

Question: .Create a scatter plot graph with best fit trend line for the above data table begin{tabular}{|c|c|c|c|} hline Run No. & Cup & Temp. (C) &
.Create a scatter plot graph with best fit trend line for the above data table
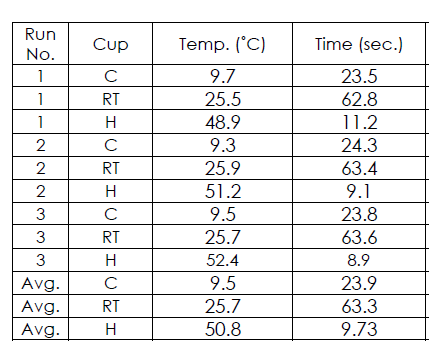
\begin{tabular}{|c|c|c|c|} \hline Run No. & Cup & Temp. (C) & Time (sec). \\ \hline 1 & C & 9.7 & 23.5 \\ \hline 1 & RT & 25.5 & 62.8 \\ \hline 1 & H & 48.9 & 11.2 \\ \hline 2 & C & 9.3 & 24.3 \\ \hline 2 & RT & 25.9 & 63.4 \\ \hline 2 & H & 51.2 & 9.1 \\ \hline 3 & C & 9.5 & 23.8 \\ \hline 3 & RT & 25.7 & 63.6 \\ \hline 3 & H & 52.4 & 8.9 \\ \hline Avg. & C & 9.5 & 23.9 \\ \hline Avg. & RT & 25.7 & 63.3 \\ \hline Avg. & H & 50.8 & 9.73 \\ \hline \end{tabular}
Step by Step Solution
There are 3 Steps involved in it
1 Expert Approved Answer
Step: 1 Unlock

Question Has Been Solved by an Expert!
Get step-by-step solutions from verified subject matter experts
Step: 2 Unlock
Step: 3 Unlock