

Question: Create a scatterplot for the data. 11 y 10 9 8 7 6- 5 4 3 2 1 X 1 2 3 4 5
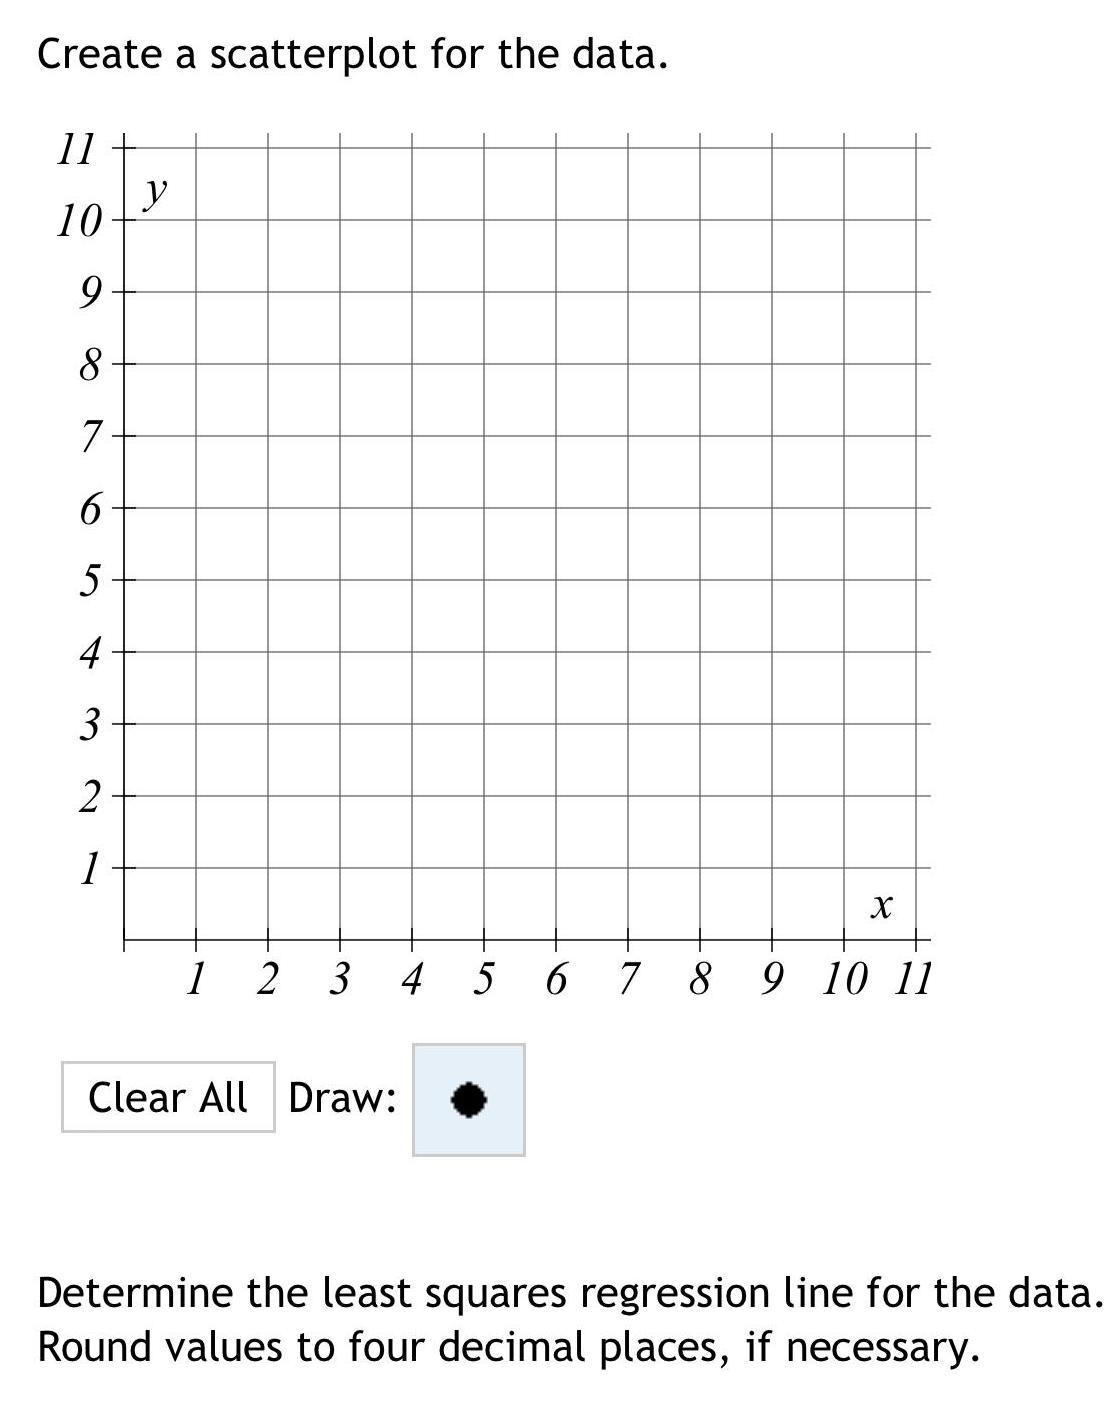
Create a scatterplot for the data. 11 y 10 9 8 7 6- 5 4 3 2 1 X 1 2 3 4 5 678 7 8 9 10 11 Clear All Draw: Determine the least squares regression line for the data. Round values to four decimal places, if necessary.
Step by Step Solution
There are 3 Steps involved in it
1 Expert Approved Answer
Step: 1 Unlock

Question Has Been Solved by an Expert!
Get step-by-step solutions from verified subject matter experts
Step: 2 Unlock
Step: 3 Unlock