

Question: Create a scatterplot for these two sets of data with line of best fit Student A B C D E F G H University Average
Create a scatterplot for these two sets of data with line of best fit
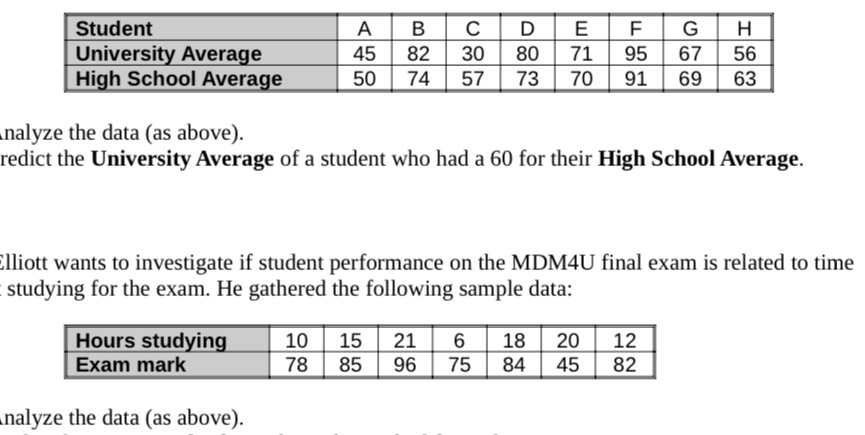
Student A B C D E F G H University Average 45 82 30 80 71 95 67 56 High School Average 50 74 57 73 70 91 69 63 nalyze the data (as above). redict the University Average of a student who had a 60 for their High School Average. lliott wants to investigate if student performance on the MDM4U final exam is related to time studying for the exam. He gathered the following sample data: Hours studying 10 15 21 6 18 20 12 Exam mark 78 85 96 75 84 45 82 nalyze the data (as above)
Step by Step Solution
There are 3 Steps involved in it
1 Expert Approved Answer
Step: 1 Unlock

Question Has Been Solved by an Expert!
Get step-by-step solutions from verified subject matter experts
Step: 2 Unlock
Step: 3 Unlock