

Question: Create a scatterplot to show the relationship between the variables x and y whose values are given in the table below X 3 8 2

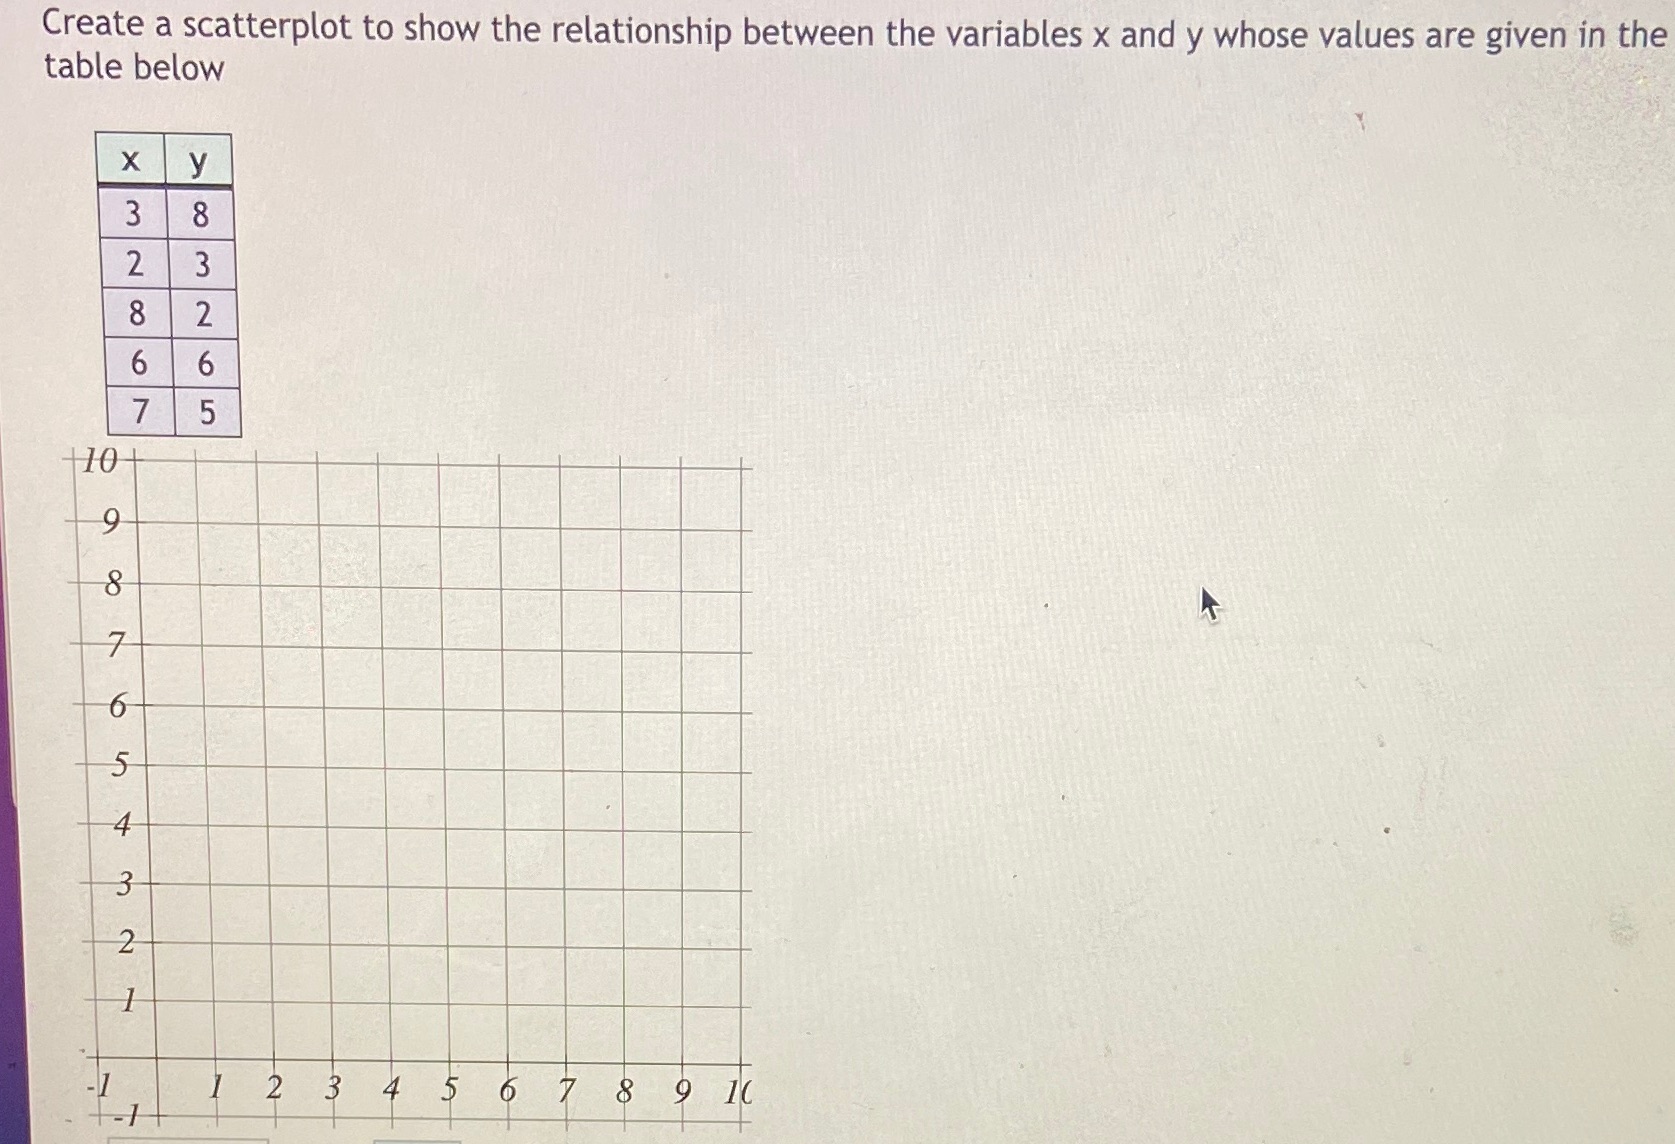
Create a scatterplot to show the relationship between the variables x and y whose values are given in the table below X 3 8 2 3 8 2 6 6 5 10 1 2 3 4 5 6 7 8 916
Step by Step Solution
There are 3 Steps involved in it
1 Expert Approved Answer
Step: 1 Unlock

Question Has Been Solved by an Expert!
Get step-by-step solutions from verified subject matter experts
Step: 2 Unlock
Step: 3 Unlock