

Question: create a sensitivity analysis in excel from the following data with a price drop of 25% and a price rise of 25% : Distribution of
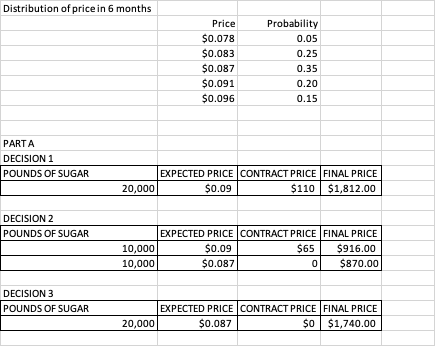
create a sensitivity analysis in excel from the following data with a price drop of 25% and a price rise of 25% : Distribution of price in 6 months Price Probability $0.078 0.05 $0.083 0.25 $0.087 0.35 $0.091 0.20 $0.096 0.15 PART A DECISION 1 POUNDS OF SUGAR EXPECTED PRICE CONTRACT PRICE FINAL PRICE20,000 $0.09 $110 $1,812.00 DECISION 2 POUNDS OF SUGAR EXPECTED PRICE CONTRACT PRICE FINAL PRICE10,000 $0.09 $65 $916.00 10,000 $0.087 0 $870.00 DECISION 3 POUNDS OF SUGAR EXPECTED PRICE CONTRACT PRICE FINAL PRICE20,000 $0.087 $0 $1,740.00
Step by Step Solution
There are 3 Steps involved in it
1 Expert Approved Answer
Step: 1 Unlock

Question Has Been Solved by an Expert!
Get step-by-step solutions from verified subject matter experts
Step: 2 Unlock
Step: 3 Unlock