

Question: Create a single figure in MATLAB that contains four subplots: 1. Bar graph ( 3D ) displaying the Robot Installations Per Region Per Year; 2.
Create a single figure in MATLAB that contains four subplots: 1. Bar graph (3D) displaying the Robot Installations Per Region Per Year; 2. Bar chart (2D) displaying manufacturing Jobs as a function of year and a line graph displaying Industrial Robot Growth per year (both on the same plot); 3. Geobubble Chart (2D) displaying Robot Density Per 10,000 Employees for the specified countries; 4. Exploded pie graph (3D) displaying the Percentage of Robots in each Industry.
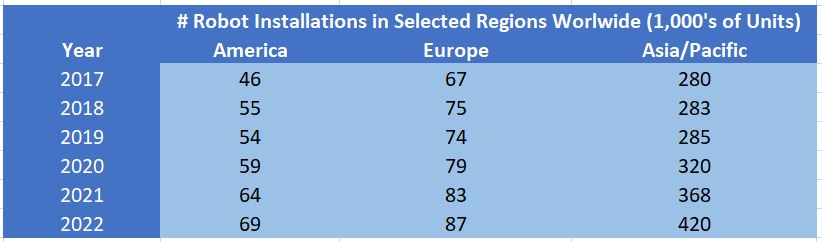
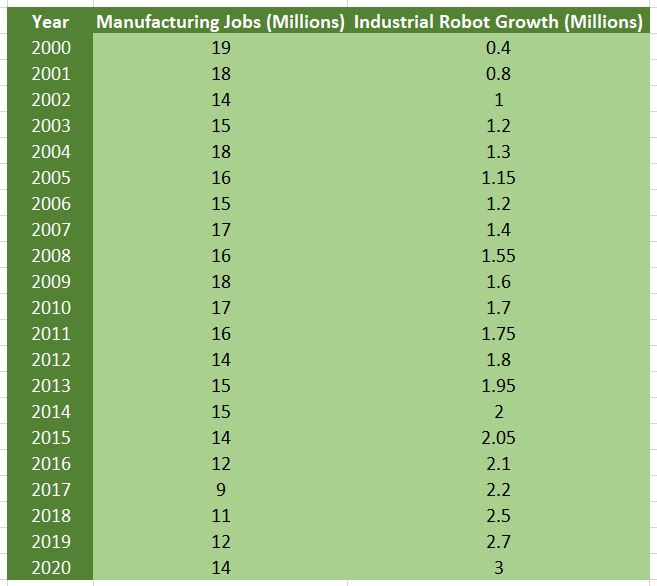
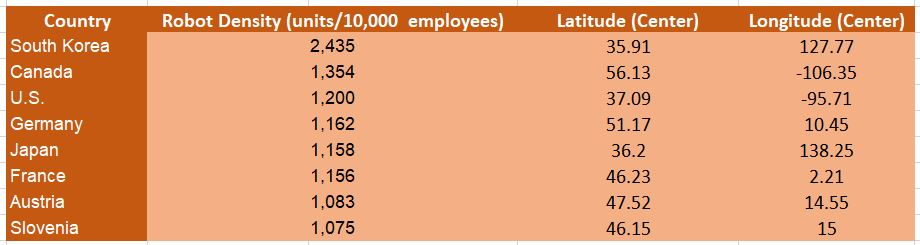
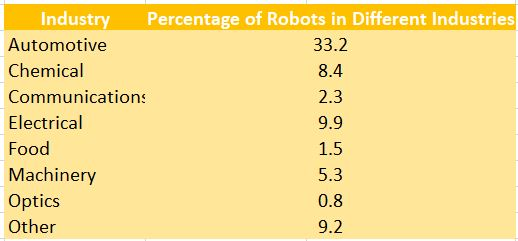
Year 67 280 55 2017 2018 2019 2020 2021 2022 # Robot Installations in Selected Regions Worlwide (1,000's of Units) America Europe Asia/Pacific 46 283 285 320 368 420 Manufacturing Jobs Millions Industrial Robot Growth (Millions) 0.4 0.8 1.2 1.3 1.15 1.2 1.4 1.55 1.6 Year 2000 2001 2002 2003 2004 2005 2006 2007 2008 2009 2010 2011 2012 2013 2014 2015 2016 2017 2018 2019 2020 1.7 1.75 1.8 1.95 2.05 2.1 Country South Korea Canada U.S. Germany Japan France Robot Density (units/10,000 employees) 2,435 1,354 1.200 1.162 1,158 1.156 1,083 1.075 Latitude Center) 35.91 56.13 37.09 51.17 36.2 46.23 47.52 46.15 Longitude Center) 127.77 -106.35 -95.71 10.45 138.25 2.21 14.55 15 Austria Slovenia Industry Percentage of Robots in Different Industries Automotive 33.2 Chemical 8.4 Communications 2.3 Electrical Food Machinery 5.3 Optics Other 9.2 0.8
Step by Step Solution
There are 3 Steps involved in it

Get step-by-step solutions from verified subject matter experts