

Question: Create a stem and leaf plot for the downtimes that were captured from the patient wait times in the waiting rooms. ( See Appendix D
- Create a stem and leaf plot for the downtimes that were captured from the patient wait times in the waiting rooms. (See Appendix D for data set.).
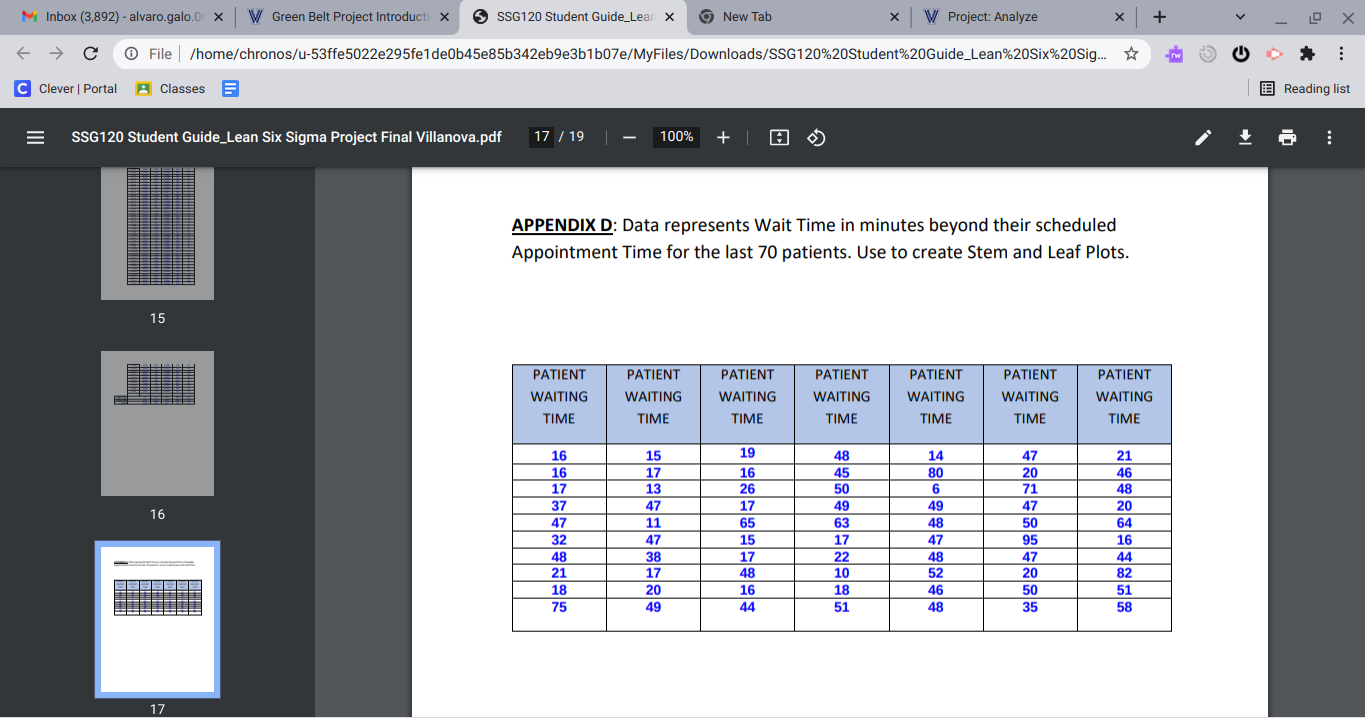
M Inbox (3,892) - alvaro.galo.0( x W Green Belt Project Introducti X 5 SSG120 Student Guide_Lean x New Tab x W Project: Analyze X + LO X > C O File | /home/chronos/u-53ffe5022e295fe1de0b45e85b342eb9e3b1607e/MyFiles/Downloads/SSG120%20Student%20Guide_Lean%20Six%20Sig.. C Clever | Portal _ Classes Reading list SSG120 Student Guide_Lean Six Sigma Project Final Villanova.pdf 17 / 19 100% + + APPENDIX D: Data represents Wait Time in minutes beyond their scheduled Appointment Time for the last 70 patients. Use to create Stem and Leaf Plots. 15 PATIENT PATIENT PATIENT PATIENT PATIENT PATIENT PATIENT WAITING WAITING WAITING WAITING WAITING WAITING WAITING TIME TIME TIME TIME TIME TIME TIME 16 15 19 48 14 47 21 16 17 16 45 80 20 46 17 13 26 50 6 71 48 49 49 16 37 47 17 47 20 47 11 65 63 48 50 64 32 47 15 17 47 95 16 48 38 17 22 48 47 44 21 17 48 10 52 20 82 18 20 16 18 46 50 51 75 49 44 51 48 35 58 17
Step by Step Solution
There are 3 Steps involved in it

Get step-by-step solutions from verified subject matter experts