

Question: Create a two-variable Data Table that shows what happens to Profit as the Annual Fixed Cost varies from $30,000 to $75,000, incrementing by $3,000 at
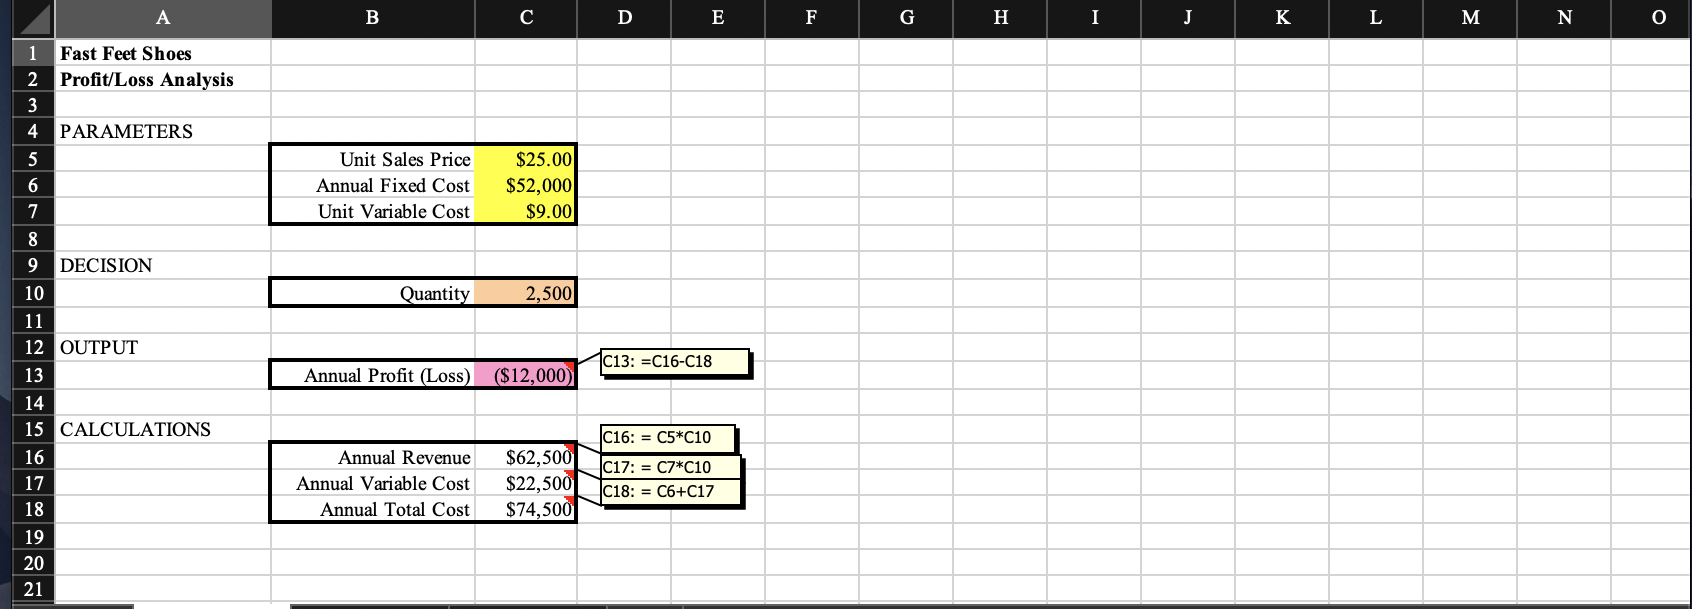
Create a two-variable Data Table that shows what happens to Profit as the Annual Fixed Cost varies from $30,000 to $75,000, incrementing by $3,000 at a time; while Unit Variable Cost varies from $5.00 to $12.00, incrementing by $1.00 at a time. Put your Annual Fixed Cost values down the rows and put your Unit Variable Cost values across the columns.
A B D E F G H I J K L M N O Unit Sales Price Annual Fixed Cost Unit Variable Cost $25.00 $52,000 $9.00 Quantity 2,500 Fast Feet Shoes 2 Profit/Loss Analysis 3 4. PARAMETERS 5 6 7 8 9 DECISION 10 11 12 OUTPUT 13 14 15 CALCULATIONS 16 17 18 19 20 21 C13: =C16-C18 Annual Profit (Loss) ($12,000) C16: = C5*C10 Annual Revenue Annual Variable Cost Annual Total Cost $62,500 $22,500 $74,500 C17: = C7*C10 C18: = C6+C17 A B D E F G H I J K L M N O Unit Sales Price Annual Fixed Cost Unit Variable Cost $25.00 $52,000 $9.00 Quantity 2,500 Fast Feet Shoes 2 Profit/Loss Analysis 3 4. PARAMETERS 5 6 7 8 9 DECISION 10 11 12 OUTPUT 13 14 15 CALCULATIONS 16 17 18 19 20 21 C13: =C16-C18 Annual Profit (Loss) ($12,000) C16: = C5*C10 Annual Revenue Annual Variable Cost Annual Total Cost $62,500 $22,500 $74,500 C17: = C7*C10 C18: = C6+C17Step by Step Solution
There are 3 Steps involved in it
1 Expert Approved Answer
Step: 1 Unlock

Question Has Been Solved by an Expert!
Get step-by-step solutions from verified subject matter experts
Step: 2 Unlock
Step: 3 Unlock