Question: create a visual chart for this data Data table for Chart 1a and 1b Table summary This table displays the results of Data table for

create a visual chart for this data create a visual chart for this data Data table
Data table for Chart 1a and 1b Table summary This table displays the results of Data table for Chart 1a and 1b 1991, 1996, 2001, 2006, 2011 and 2015, calculated using percent units of measure (appearing as column headers). 1991 1996 2001 2006 2011 2015 percent Women No certificate, diploma or degree 24 19 15 11 9 High school diploma or equivalent 31 30 28 26 25 23 Trades certificate 10 9 9 9 8 7 College diploma 14 21 23 25 26 University certificate, diploma or 15 19 23 27 31 35 degree Men No certificate, diploma or degree 31 25 20 16 11 High school diploma 26 25 26 25 25 25 Trades certificate 14 16 15 16 15 College diploma 9 13 15 17 18 19 University certificate, diploma or 19 21 24 28 30 degree Note: Excludes the Territories. Source: Statistics Canada, Labour Force Survey, annual average, 1991, 1996, 2001, 2006, 2011, 2015. 19 13 15 26

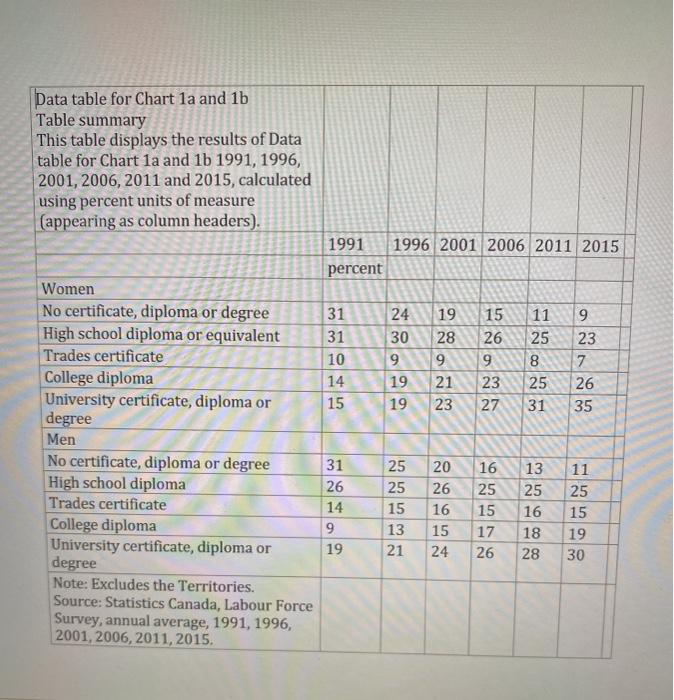
Step by Step Solution

There are 3 Steps involved in it

1 Expert Approved Answer
Step: 1 Unlock blur-text-image
Question Has Been Solved by an Expert!

Get step-by-step solutions from verified subject matter experts

Step: 2 Unlock
Step: 3 Unlock

Students Have Also Explored These Related General Management Questions!