

Question: Create an earned value chart using the above information by creating a spreadsheet using MS Excel 2007 or newer. Once you have input your data,
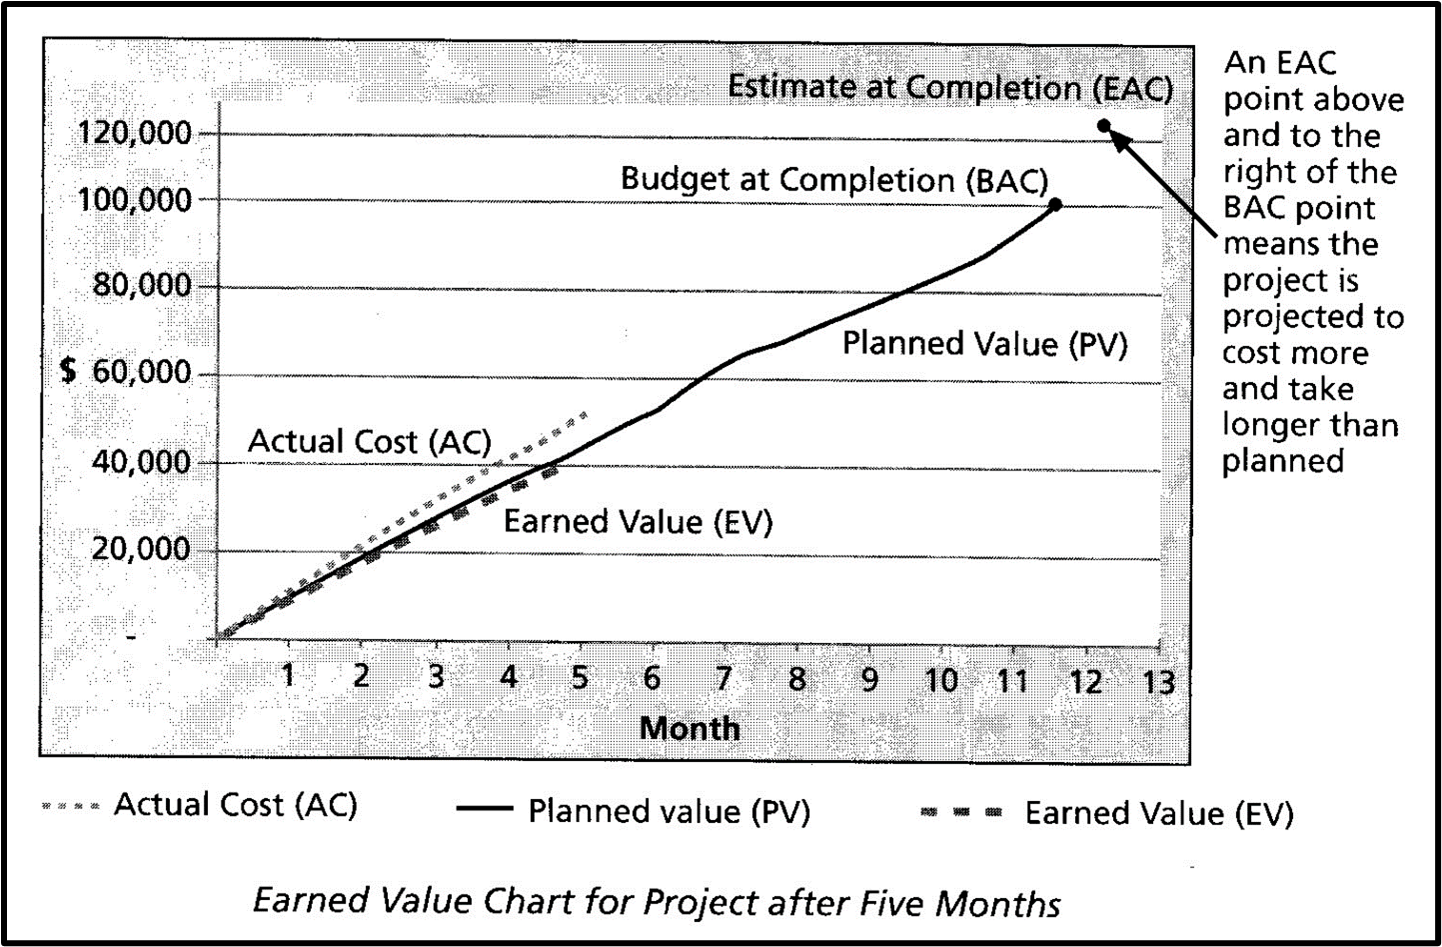
- Create an earned value chart using the above information by creating a spreadsheet using MS Excel 2007 or newer. Once you have input your data, create a snapshot of your chart and attach it to this answer sheet. Retain the spreadsheet for follow-on reference. Use the example EV chart below as a guide.
 Using the below charts and numbers:
| BAC = | 0 | 200,000 |
| PV = | 0 | $120,000 |
| EV = | 0 | 100,000 |
| AC = | 0 | 90,000 |
| Time = | 0 | 6 Months |
| CV = | 0 | 10,000 |
| SV = | 0 | -20,000 |
| CPI = | 0 | 26.60% |
| SPI = | 0 | 83.33% |
| EAC = | 0 | 7,518.80 |
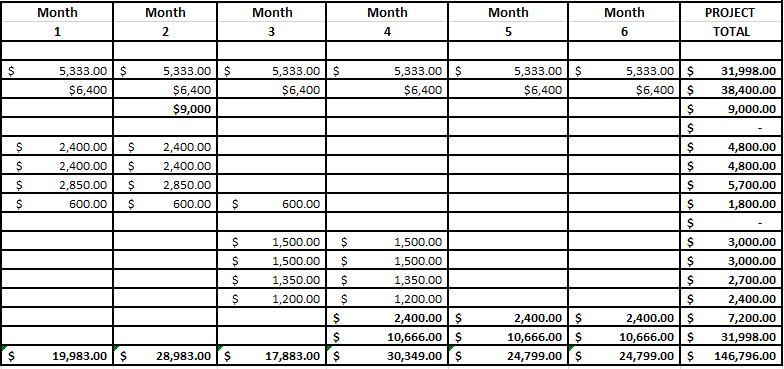
Estimate at Completion (EAC) 120,000 Budget at Completion (BAC) 100,000 An EAC point above and to the right of the BAC point means the project is projected to cost more and take longer than planned 80,000 Planned Value (PV) $ 60,000 Actual Cost (AC) 40,000 Earned Value (EV) 20,000 3 6 7 8 9 10 11 12 13 Month Actual Cost (AC) Planned value (PV) Earned Value (EV) Earned Value Chart for Project after Five Months Month Month 1 Month 2 Month 4 Month 5 Month 6 PROJECT TOTAL 3 $ 5,333.00 $ $6,400 5,333.00 $ $6,400 $9,000 5,333.00 $ $6,400 5,333.00 $ $6,400 5,333.00 $ $6,400 5,333.00 $ $6,400 $ $ $ $ 31,998.00 38,400.00 9,000.00 S S 2,400.00 2,400.00 2,850.00 600.00 ulullon 2,400.00 2,400.00 2,850.00 600.00 UUUU 4,800.00 4,800.00 5,700.00 1,800.00 $ S $ 600.00 $ $ $ $ $ $ $ $ 1,500.00 $ 1,500.00 $ 1,350.00 S 1,200.00 $ $ $ 17,883.00 $ 1,500.00 1,500.00 1,350.00 1,200.00 2,400.00 $ 10,666.00 $ 30,349.00 $ 3,000.00 3,000.00 2,700.00 2,400.00 7,200.00 31,998.00 146,796.00 $ 2,400.00 $ 10,666.00 $ 24,799.00 $ 2,400.00 $ 10,666.00 $ 24,799.00 $ $ 19,983.00 $ 28,983.00 $ Estimate at Completion (EAC) 120,000 Budget at Completion (BAC) 100,000 An EAC point above and to the right of the BAC point means the project is projected to cost more and take longer than planned 80,000 Planned Value (PV) $ 60,000 Actual Cost (AC) 40,000 Earned Value (EV) 20,000 3 6 7 8 9 10 11 12 13 Month Actual Cost (AC) Planned value (PV) Earned Value (EV) Earned Value Chart for Project after Five Months Month Month 1 Month 2 Month 4 Month 5 Month 6 PROJECT TOTAL 3 $ 5,333.00 $ $6,400 5,333.00 $ $6,400 $9,000 5,333.00 $ $6,400 5,333.00 $ $6,400 5,333.00 $ $6,400 5,333.00 $ $6,400 $ $ $ $ 31,998.00 38,400.00 9,000.00 S S 2,400.00 2,400.00 2,850.00 600.00 ulullon 2,400.00 2,400.00 2,850.00 600.00 UUUU 4,800.00 4,800.00 5,700.00 1,800.00 $ S $ 600.00 $ $ $ $ $ $ $ $ 1,500.00 $ 1,500.00 $ 1,350.00 S 1,200.00 $ $ $ 17,883.00 $ 1,500.00 1,500.00 1,350.00 1,200.00 2,400.00 $ 10,666.00 $ 30,349.00 $ 3,000.00 3,000.00 2,700.00 2,400.00 7,200.00 31,998.00 146,796.00 $ 2,400.00 $ 10,666.00 $ 24,799.00 $ 2,400.00 $ 10,666.00 $ 24,799.00 $ $ 19,983.00 $ 28,983.00 $
Step by Step Solution
There are 3 Steps involved in it

Get step-by-step solutions from verified subject matter experts