

Question: create an excel file with worksheet named ratio. attached in the first picthrw is consolidated statement of earn and in the second pic consolidated balance
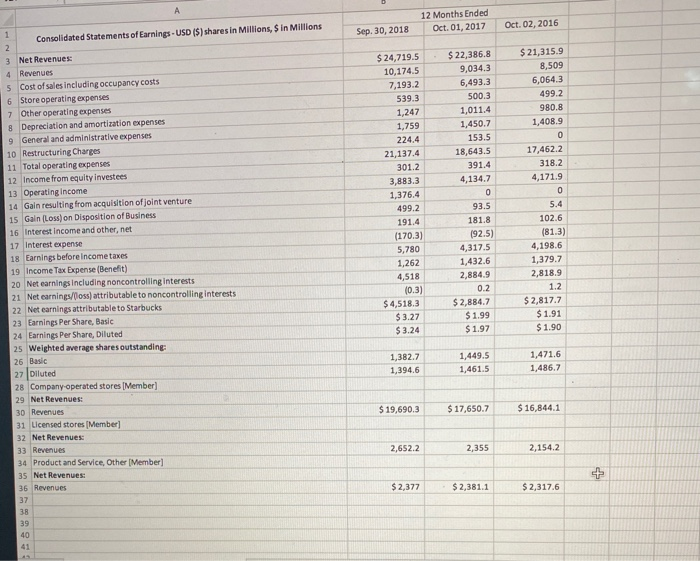
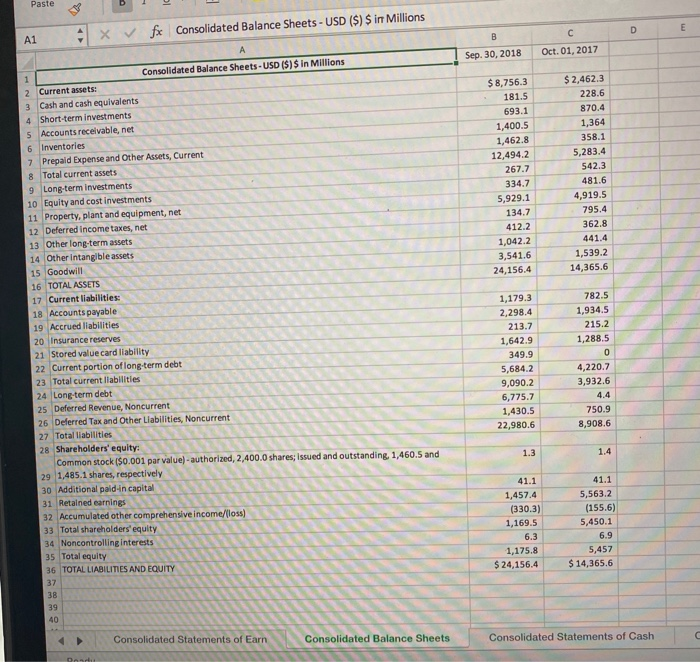
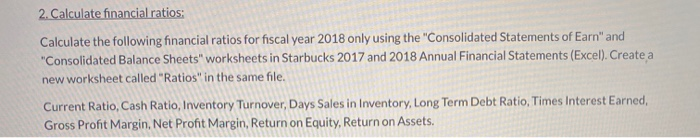
12 Months Ended Oct. 01, 2017 Oct 02, 2016 Sep 30, 2018 $ 22,386.8 9,034.3 6,493.3 500.3 1,011.4 1,450.7 153.5 18,643.5 391.4 4,134.7 1 Consolidated Statements of Earnings - USD ($) shares in Millions, $ in Millions 2 3 Net Revenues 4 Revenues 5 Cost of sales including occupancy costs 6 Store operating expenses 7 Other operating expenses 8 Depreciation and amortization expenses 9 General and administrative expenses 10 Restructuring Charges 11 Total operating expenses 12 Income from equity investees 13 Operating income 14 Gain resulting from acquisition of joint venture 15 Gain (Loss) on Disposition of Business 16 Interest Income and other, net 17 Interest expense 18 Earnings before income taxes 19 Income Tax Expense (Benefit) 20 Net earnings including noncontrolling interests 21 Net earnings/(oss) attributable to noncontrolling interests 22 Net earnings attributable to Starbucks 23 Earnings Per Share, Basic 24 Earnings Per Share, Diluted 25 Weighted average shares outstanding 26 Basic 27 Diluted 28 Company operated stores (Member) 29 Net Revenues: 30 Revenues 31 Licensed stores (Member) 32 Net Revenue 33 Revenues 34 Product and Service, Other (Member) 35 Net Revenues: 36 Revenues 37 38 39 40 41 $ 24,719.5 10,174.5 7,193.2 539.3 1,247 1,759 224,4 21,137.4 301.2 3,883.3 1,376.4 499.2 191.4 (170.3) 5,780 1,262 4,518 (0.3) $ 4,518.3 $ 3.27 $ 3.24 $ 21,315.9 8,509 6,064.3 499.2 980.8 1,408.9 0 17,462.2 318.2 4,171.9 0 5.4 102.6 (81.3) 4,198.6 1,379.7 2,818.9 1.2 $ 2,817.7 $1.91 $ 1.90 93.5 181.8 192.5) 4,317.5 1,432.6 2,884.9 0.2 $2,884.7 $ 1.99 $1.97 1,382.7 1,394,6 1,449.5 1,461.5 1,471.6 1,486.7 $ 19,690.3 $ 17,650.7 $ 16,844.1 2,652.2 2,355 2,154.2 + $2,377 $ 2,381.1 $ 2,317.6 Paste ol D E A1 xfx Consolidated Balance Sheets - USD ($) $ in Millions B Sep 30, 2018 Oct. 01, 2017 $8,756.3 181.5 693.1 1,400.5 1,462.8 12,494.2 267.7 334.7 5,929.1 134.7 412.2 1,042.2 3,541.6 24,156.4 $ 2,462.3 228.6 870.4 1,364 358.1 5,283.4 542.3 481.6 4,919.5 795.4 362.8 441.4 1,539.2 14,365.6 Consolidated Balance Sheets - USD ($) $ in Millions 1 2 Current assets: 3 Cash and cash equivalents 4 Short-term investments 5 Accounts receivable, net 6 Inventories 7 Prepaid Expense and Other Assets, Current 8 Total current assets 9 Long-term investments 10 Equity and cost investments 11 Property, plant and equipment, net 12 Deferred income taxes, net 13 Other long-term assets 14 Other intangible assets 15 Goodwill 16 TOTAL ASSETS 17 Current liabilities: 18 Accounts payable 19 Accrued liabilities 20 Insurance reserves 21 Stored value card liability 22 Current portion of long-term debt 23 Total current liabilities 24 Long-term debt 25 Deferred Revenue, Noncurrent 26 Deferred Tax and Other Liabilities, Noncurrent 27 Total liabilities 28 Shareholders' equity Common stock ($0.001 par value) - authorized, 2,400.0 shares; Issued and outstanding 1,460.5 and 29 1,485.1 shares, respectively 30 Additional pald-in capital 31 Retained earnings 32 Accumulated other comprehensive income/loss) 33 Total shareholders' equity 34 Noncontrolling interests 35 Total equity 36 TOTAL LIABILITIES AND EQUITY 37 38 39 40 1,179.3 2,298.4 213.7 1,642.9 349.9 5,684.2 9,090.2 6,775.7 1,430.5 22,980.6 782.5 1,934.5 215.2 1,288.5 0 4,220.7 3,932.6 4.4 750.9 8,908.6 1.3 1.4 41.1 1,457.4 (330.3) 1,169.5 6.3 1,175.8 $ 24,156.4 41.1 5,563.2 (155.6) 5,450.1 6.9 5,457 $ 14,365.6 Consolidated Statements of Earn Consolidated Balance Sheets Consolidated Statements of Cash 2. Calculate financial ratios: Calculate the following financial ratios for fiscal year 2018 only using the "Consolidated Statements of Earn" and "Consolidated Balance Sheetsworksheets in Starbucks 2017 and 2018 Annual Financial Statements (Excel). Create a new worksheet called "Ratios" in the same file. Current Ratio, Cash Ratio, Inventory Turnover, Days Sales in Inventory, Long Term Debt Ratio, Times Interest Earned, Gross Profit Margin, Net Profit Margin, Return on Equity, Return on Assets
Step by Step Solution
There are 3 Steps involved in it

Get step-by-step solutions from verified subject matter experts