

Question: Create an Excel Spreadsheet to answer the following ratios: [SHOW STEPS] Profitability Gross Margin = Gross Profit /Sales Operating Margin = Operating Income / Sales
Create an Excel Spreadsheet to answer the following ratios: [SHOW STEPS]
![Create an Excel Spreadsheet to answer the following ratios: [SHOW STEPS] Profitability](https://dsd5zvtm8ll6.cloudfront.net/si.experts.images/questions/2024/10/67037d399aabd_91367037d3920778.jpg)
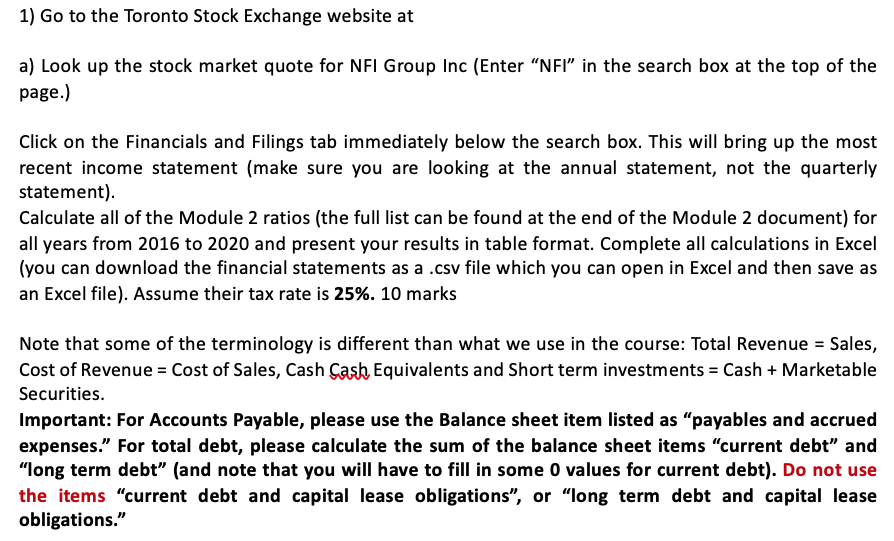
Profitability Gross Margin = Gross Profit /Sales Operating Margin = Operating Income / Sales Net Profit Margin = Net Income / Sales Liquidity Current ratio = current assets / current liabilities Quick ratio = (cash + marketable securities + accounts receivable) / current liabilities Cash ratio = Cash/current liabilities Working Capital Accounts receivable days = Accounts Receivable /(Sales/365) Accounts payable days = Accounts payable /(Cost of Sales/365) Inventory turnover = Annual cost of sales /inventory Interest Coverage EBIT/Interest Expense EBITDA /Interest expense Leverage Debt-equity ratio = total debt / total equity Debt-to-capital ratio = total debt /(total debt + total equity) Debt-to-Enterprise Value ratio = Net debt / (Enterprise Value) Valuation Price-earnings (P/E) ratio = Share Price / Earnings per Share Operating Returns Return on Equity = Net Income / Book Value of Equity Return on Assets = Net Income / Total Assets Return on invested capital = EBIT (1 tax rate) /(Book value of equity + Net debt) 1) Go to the Toronto Stock Exchange website at a) Look up the stock market quote for NFL Group Inc (Enter "NFI in the search box at the top of the page.) Click on the Financials and Filings tab immediately below the search box. This will bring up the most recent income statement (make sure you are looking at the annual statement, not the quarterly statement). Calculate all of the Module 2 ratios (the full list can be found at the end of the Module 2 document) for all years from 2016 to 2020 and present your results in table format. Complete all calculations in Excel (you can download the financial statements as a .csv file which you can open in Excel and then save as an Excel file). Assume their tax rate is 25%. 10 marks Note that some of the terminology is different than what we use in the course: Total Revenue = Sales, Cost of Revenue = Cost of Sales, Cash Cash Equivalents and Short term investments - Cash + Marketable Securities. Important: For Accounts Payable, please use the Balance sheet item listed as "payables and accrued expenses. For total debt, please calculate the sum of the balance sheet items "current debt" and "long term debt" (and note that you will have to fill in some 0 values for current debt). Do not use the items "current debt and capital lease obligations", or "long term debt and capital lease obligations." Profitability Gross Margin = Gross Profit /Sales Operating Margin = Operating Income / Sales Net Profit Margin = Net Income / Sales Liquidity Current ratio = current assets / current liabilities Quick ratio = (cash + marketable securities + accounts receivable) / current liabilities Cash ratio = Cash/current liabilities Working Capital Accounts receivable days = Accounts Receivable /(Sales/365) Accounts payable days = Accounts payable /(Cost of Sales/365) Inventory turnover = Annual cost of sales /inventory Interest Coverage EBIT/Interest Expense EBITDA /Interest expense Leverage Debt-equity ratio = total debt / total equity Debt-to-capital ratio = total debt /(total debt + total equity) Debt-to-Enterprise Value ratio = Net debt / (Enterprise Value) Valuation Price-earnings (P/E) ratio = Share Price / Earnings per Share Operating Returns Return on Equity = Net Income / Book Value of Equity Return on Assets = Net Income / Total Assets Return on invested capital = EBIT (1 tax rate) /(Book value of equity + Net debt) 1) Go to the Toronto Stock Exchange website at a) Look up the stock market quote for NFL Group Inc (Enter "NFI in the search box at the top of the page.) Click on the Financials and Filings tab immediately below the search box. This will bring up the most recent income statement (make sure you are looking at the annual statement, not the quarterly statement). Calculate all of the Module 2 ratios (the full list can be found at the end of the Module 2 document) for all years from 2016 to 2020 and present your results in table format. Complete all calculations in Excel (you can download the financial statements as a .csv file which you can open in Excel and then save as an Excel file). Assume their tax rate is 25%. 10 marks Note that some of the terminology is different than what we use in the course: Total Revenue = Sales, Cost of Revenue = Cost of Sales, Cash Cash Equivalents and Short term investments - Cash + Marketable Securities. Important: For Accounts Payable, please use the Balance sheet item listed as "payables and accrued expenses. For total debt, please calculate the sum of the balance sheet items "current debt" and "long term debt" (and note that you will have to fill in some 0 values for current debt). Do not use the items "current debt and capital lease obligations", or "long term debt and capital lease obligations
Step by Step Solution
There are 3 Steps involved in it

Get step-by-step solutions from verified subject matter experts