

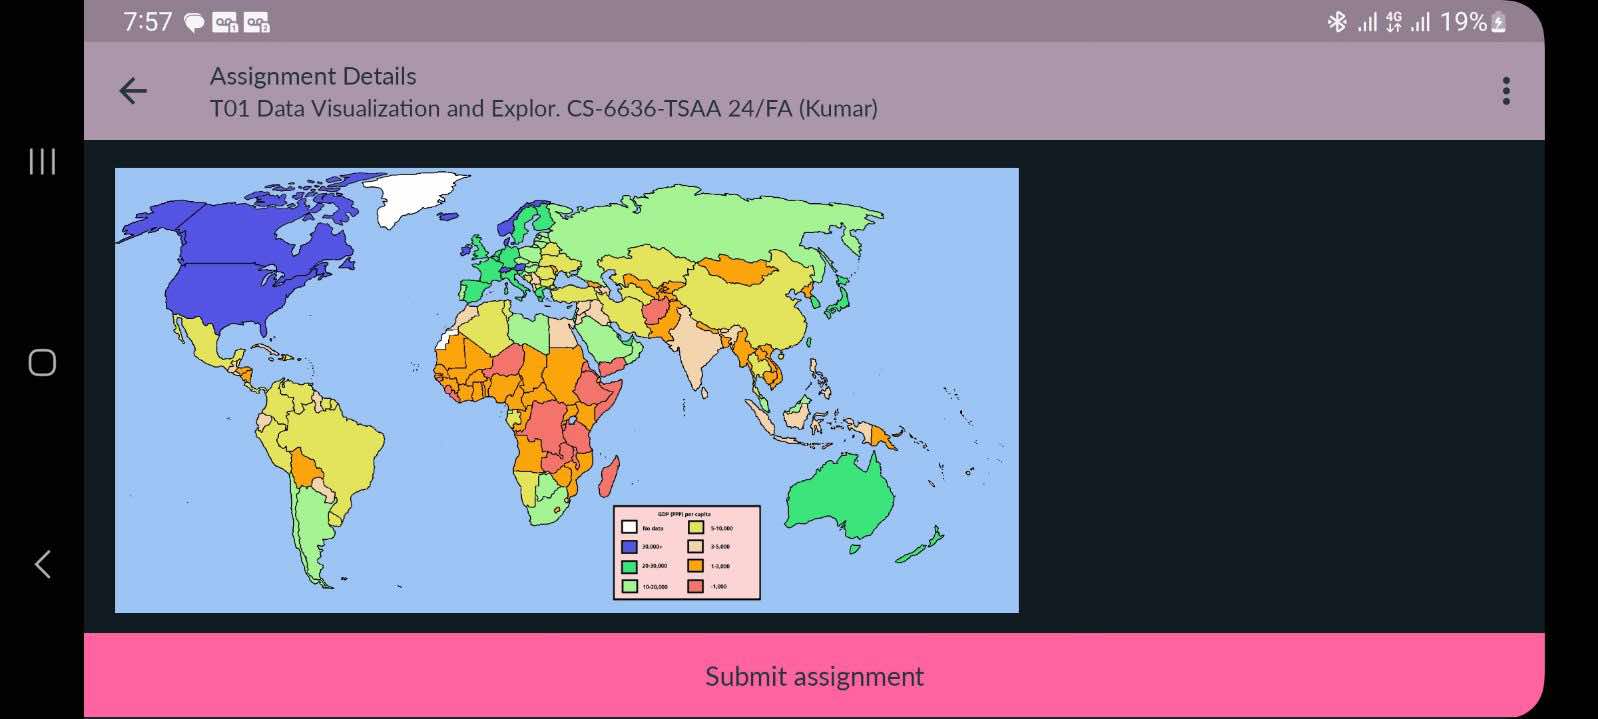
Question: - > Create an interactive visualization dashboard using D 3 . js that displays key development indicators across countries. Create a Choropleth Map visualizing metrics
Create an interactive visualization dashboard using Djs that displays key development indicators across countries. Create a Choropleth Map visualizing metrics such as GDP per capita, literacy rates, life expectancy, and access to electricity.Add a dropdown menu to allow users to select different development indicators eg GDP literacy, life expectancy Each selected indicator should update the map with relevant color gradients for easy comparison.
Submit assignment
Step by Step Solution
There are 3 Steps involved in it
1 Expert Approved Answer
Step: 1 Unlock

Question Has Been Solved by an Expert!
Get step-by-step solutions from verified subject matter experts
Step: 2 Unlock
Step: 3 Unlock