

Question: Create an R script to answer exercise 9. Use R comments (i.e., using #) to summarize your answers obtained from the corresponding R commands. 9.
Create an R script to answer exercise 9. Use R comments (i.e., using "#") to summarize your answers obtained from the corresponding R commands.
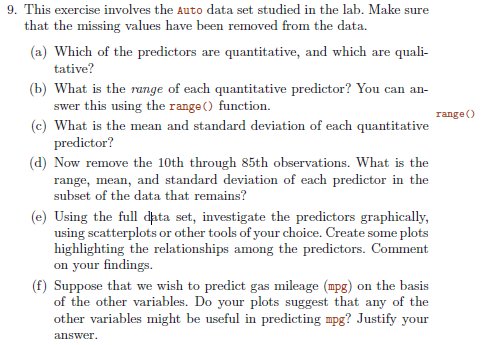
9. This exercise involves the Auto data set studied in the lab. Make sure that the missing values have been removed from the data. (a) Which of the predictors are quantitative, and which are quali- b) What is the range of each quantitative predictor? You can an- (c) What is the mean and standard deviation of each quantitative tative? swer this using the range) function. range) predictor? (d) Now remove the 10th through 85th observations. What is the range, mean, and standard deviation of each predictor in the subset of the data that remains? (e) Using the full data set, investigate the predictors graphically, or other tools of your choice. Create some plots highlighting the relationships among the predictors. Comment using scatterplots on your findin gs. (f) Suppose that we wish to predict gas mileage (mpg) on the basis of the other variables. Do your plots suggest that any of the other variables might be useful in predicting mpg? Justify your
Step by Step Solution
There are 3 Steps involved in it

Get step-by-step solutions from verified subject matter experts