Question: CREATE CHANGE Part 1- Spreadsheet Task 30 marks (15%) [Use the template Excel File on the BB website] a) Market and Investor Analysis The proposed
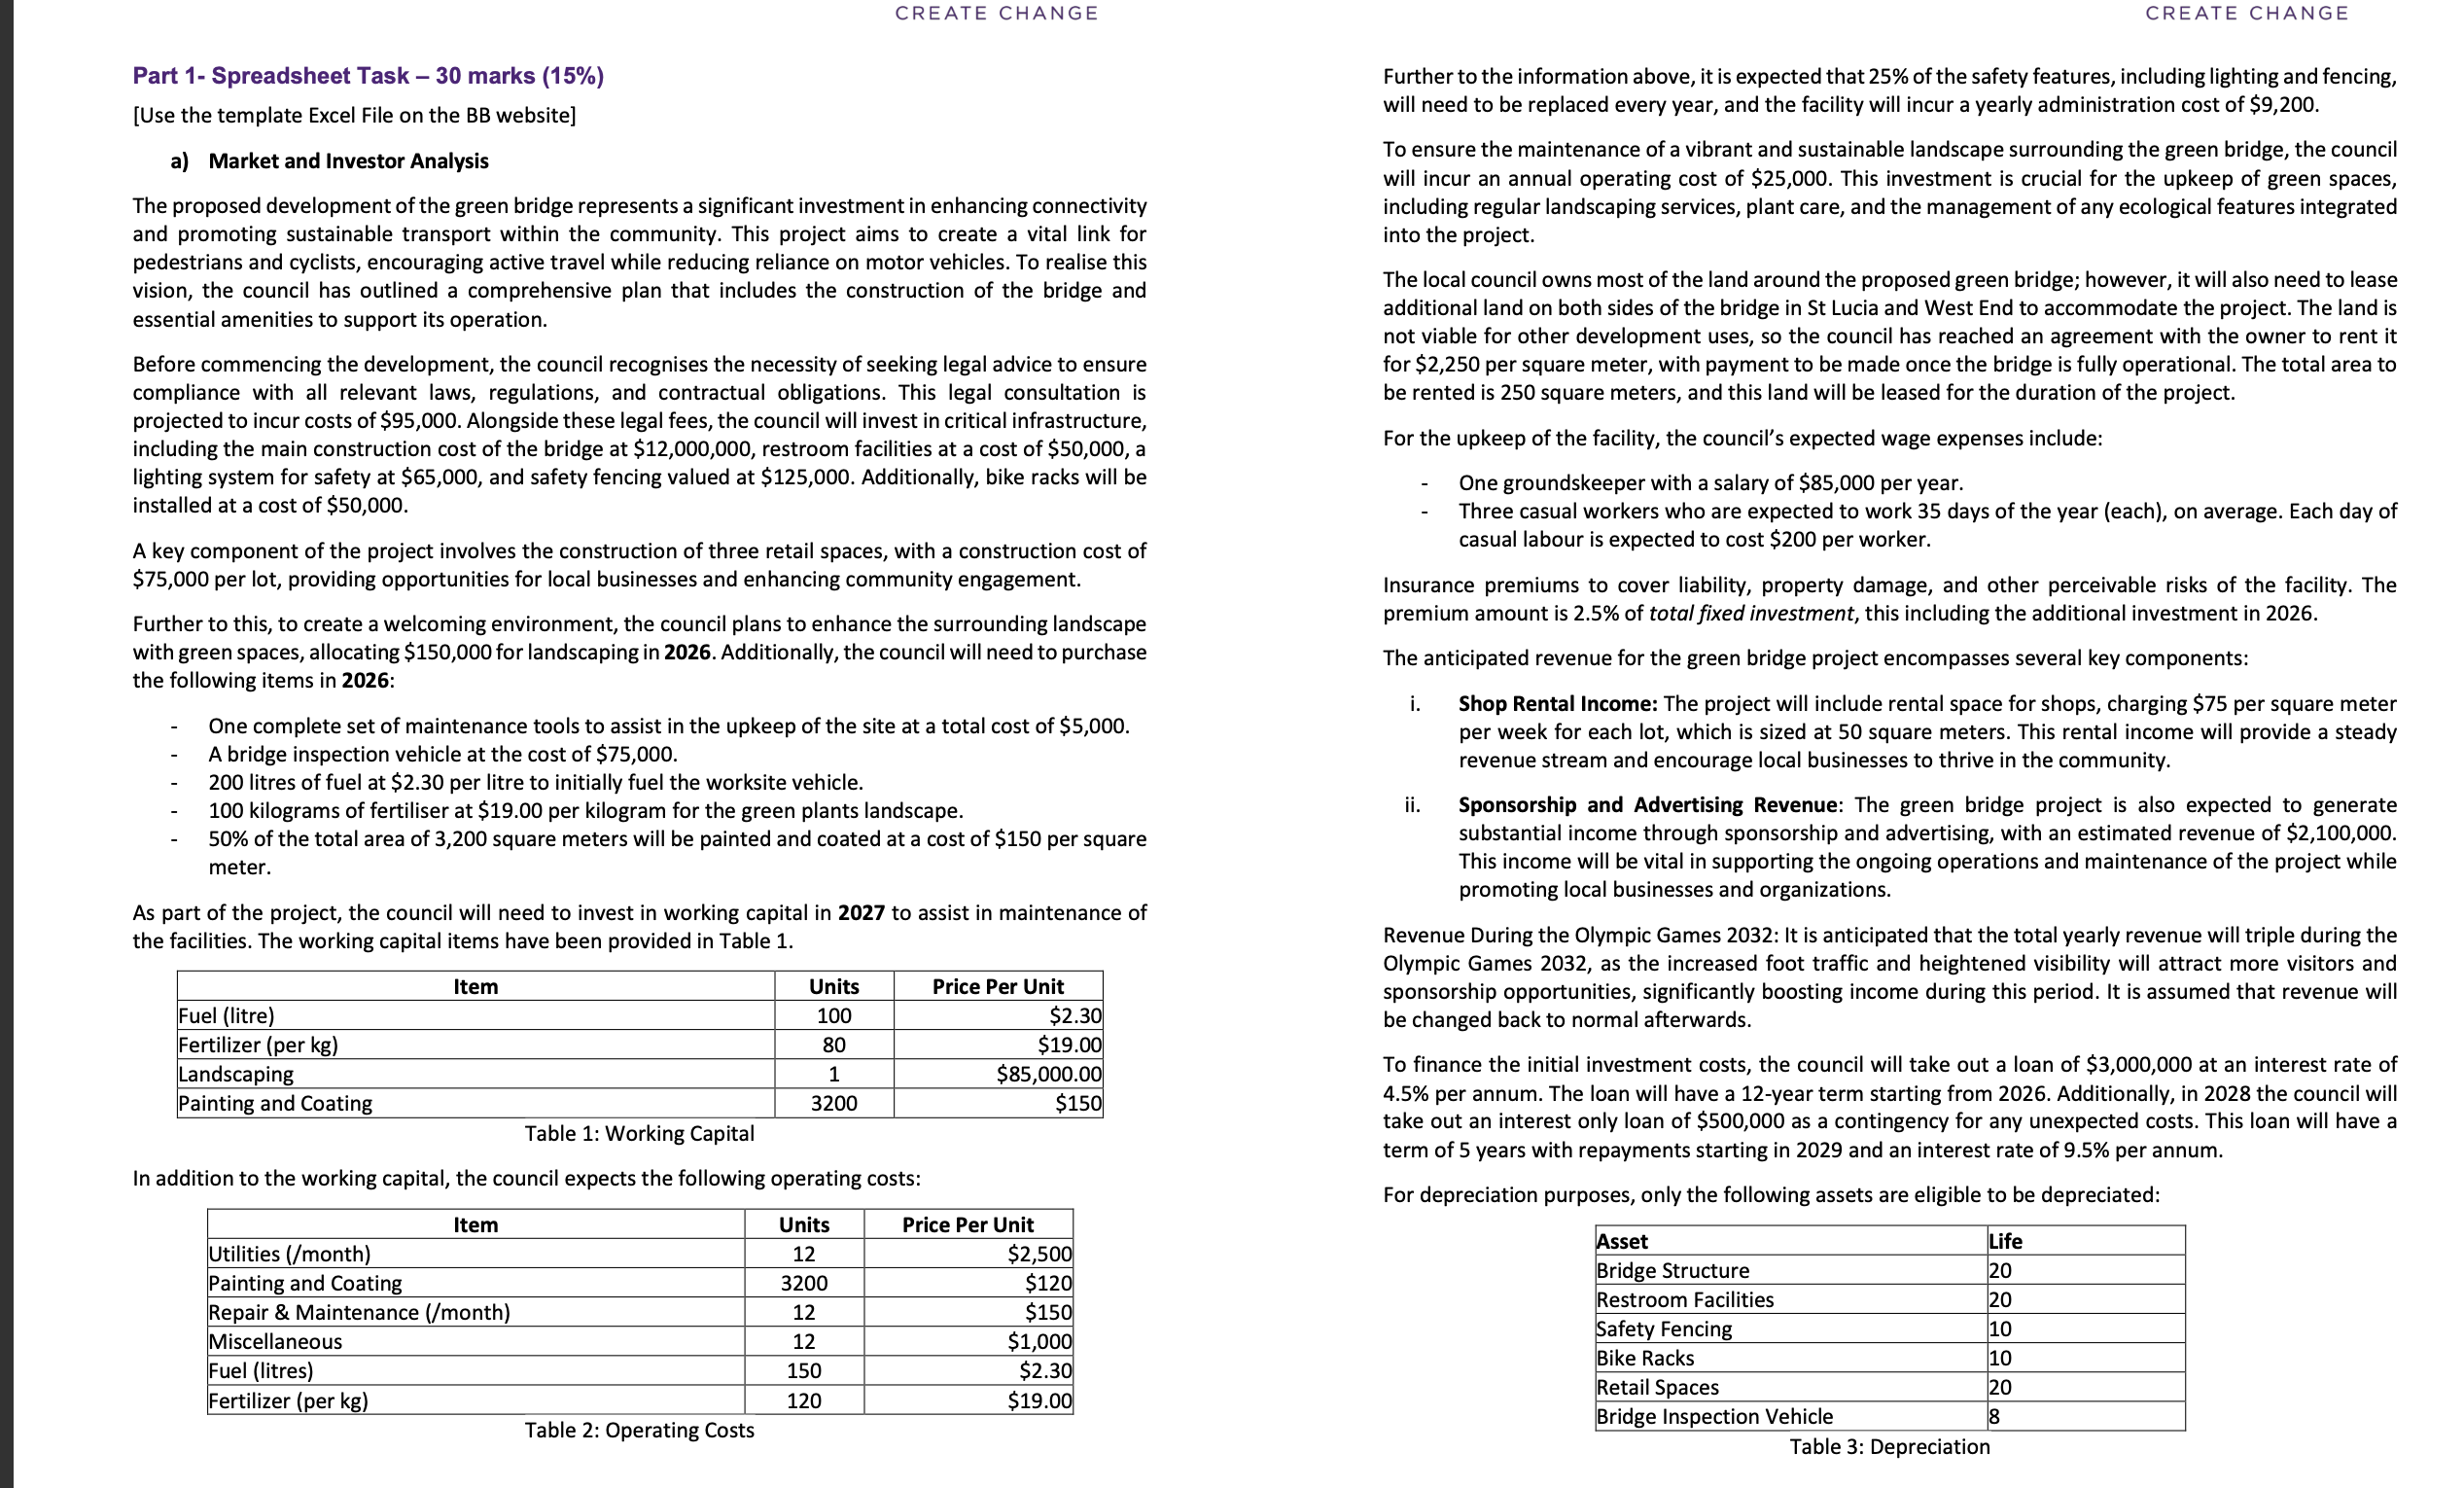
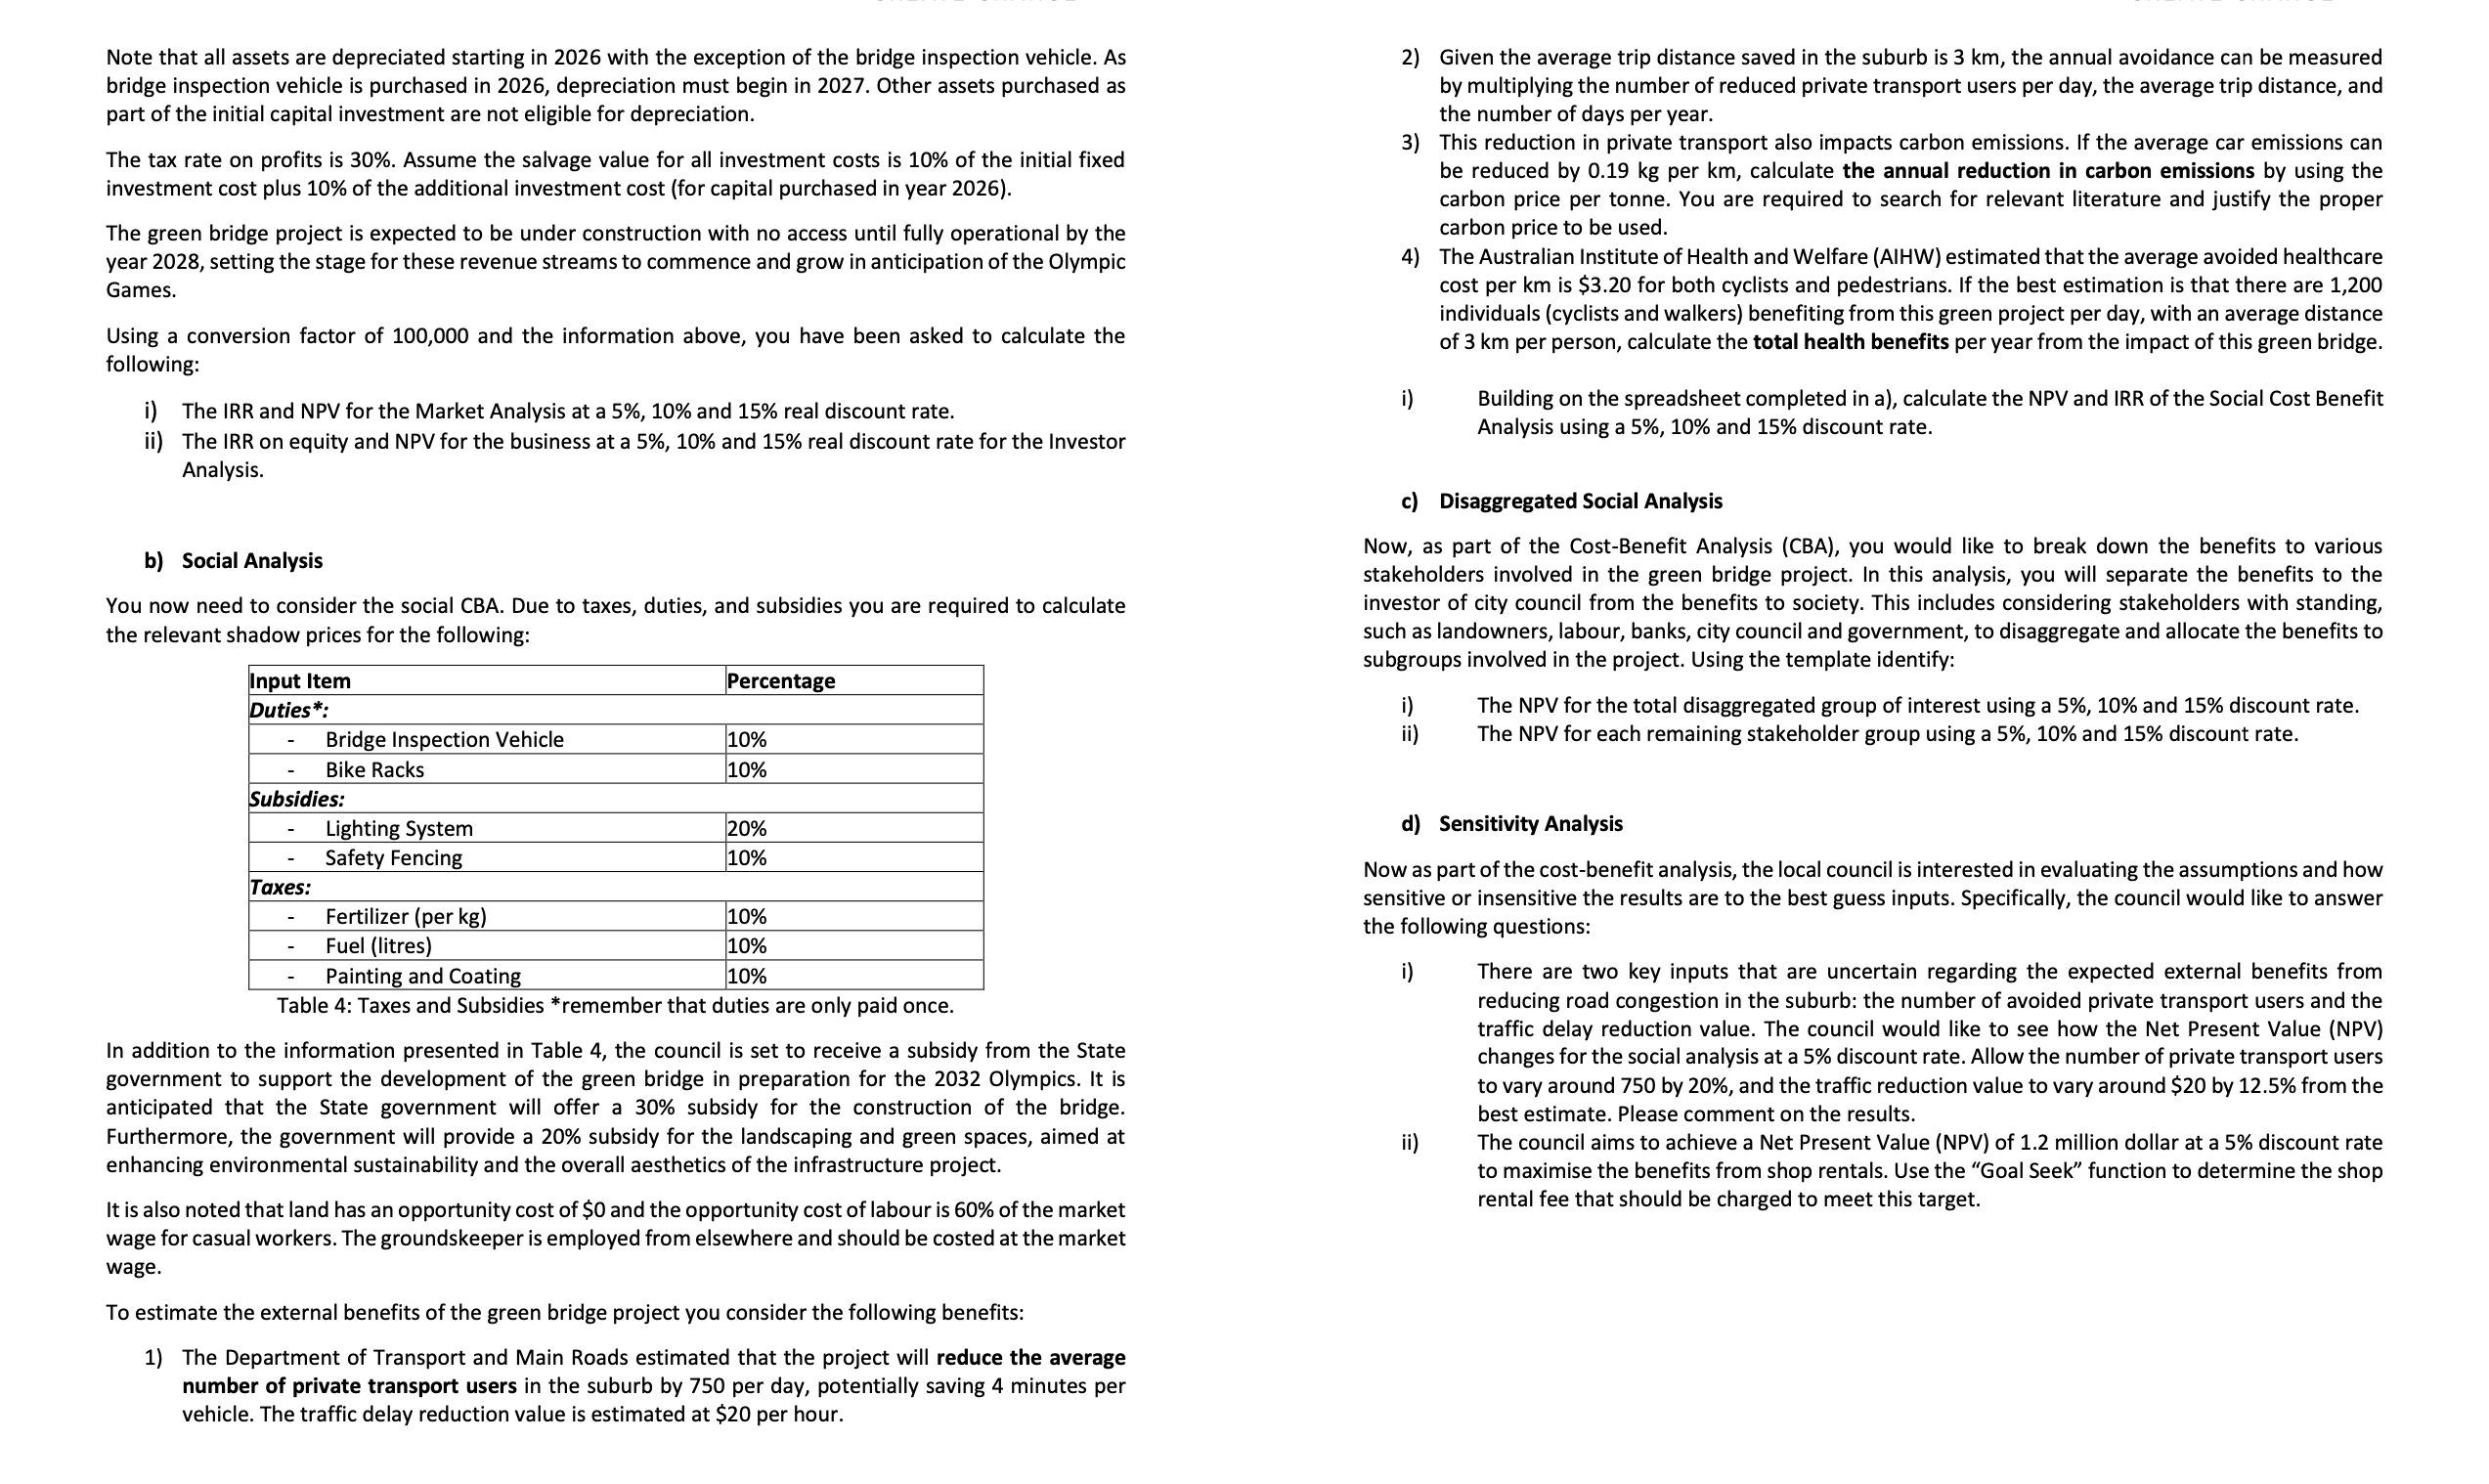
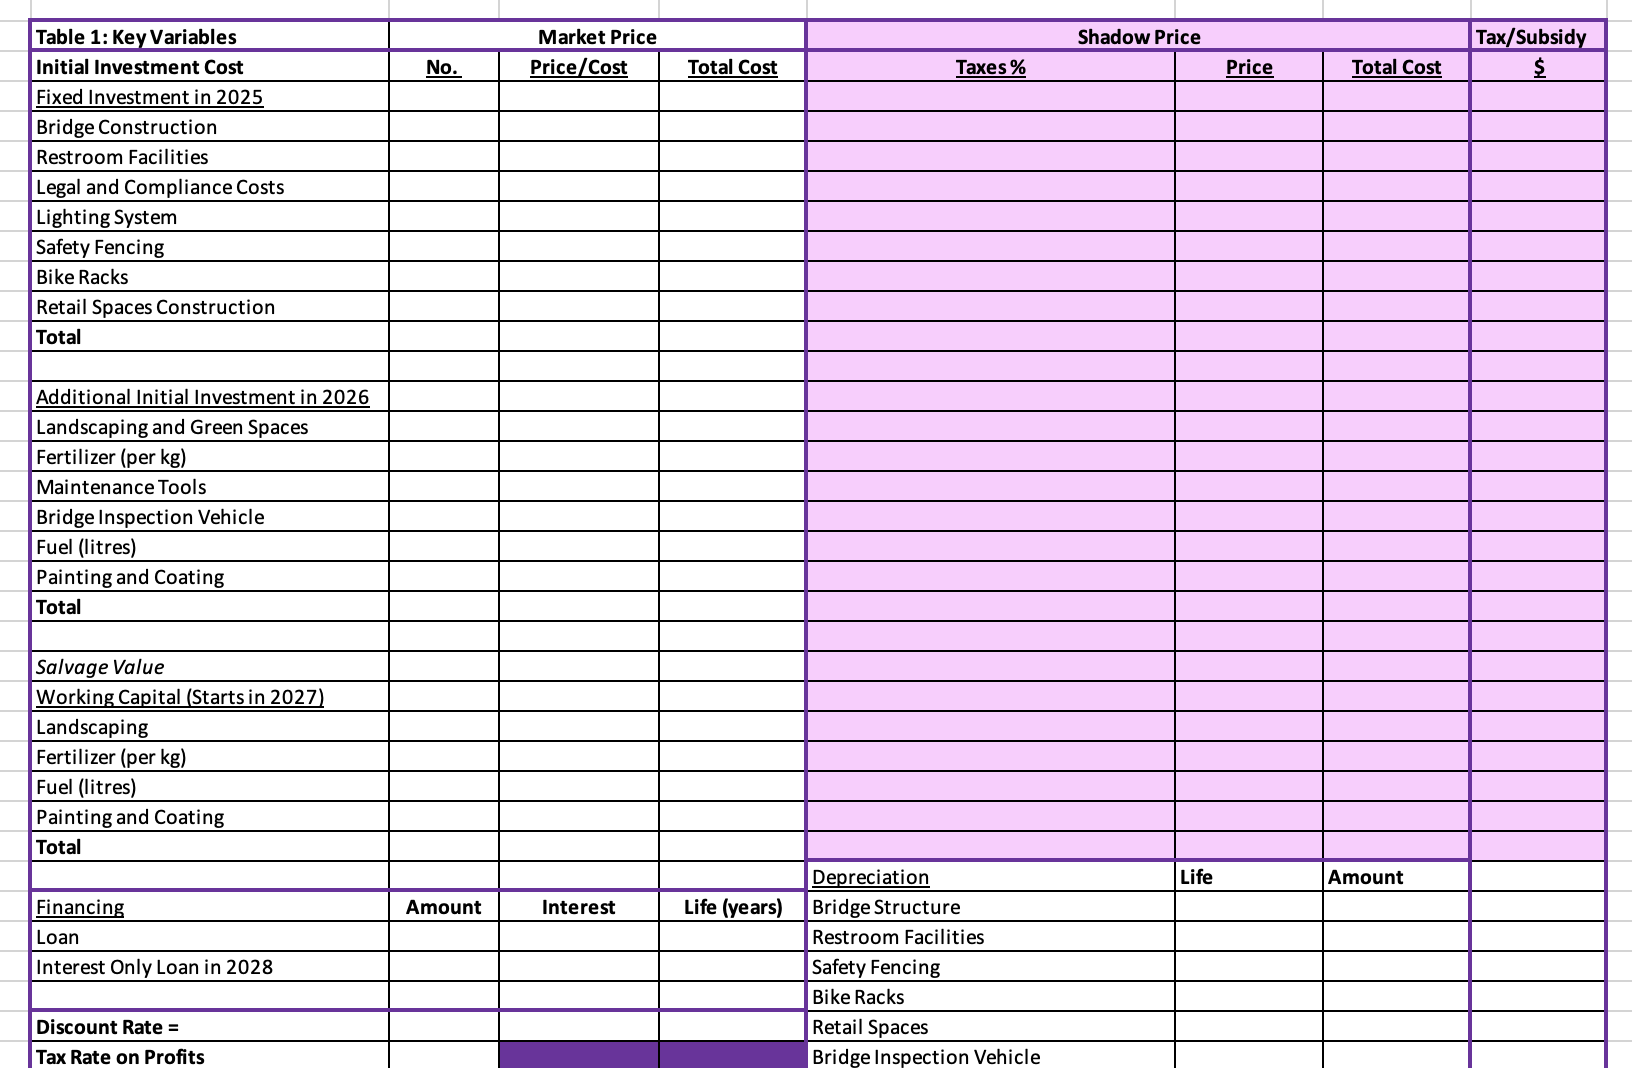
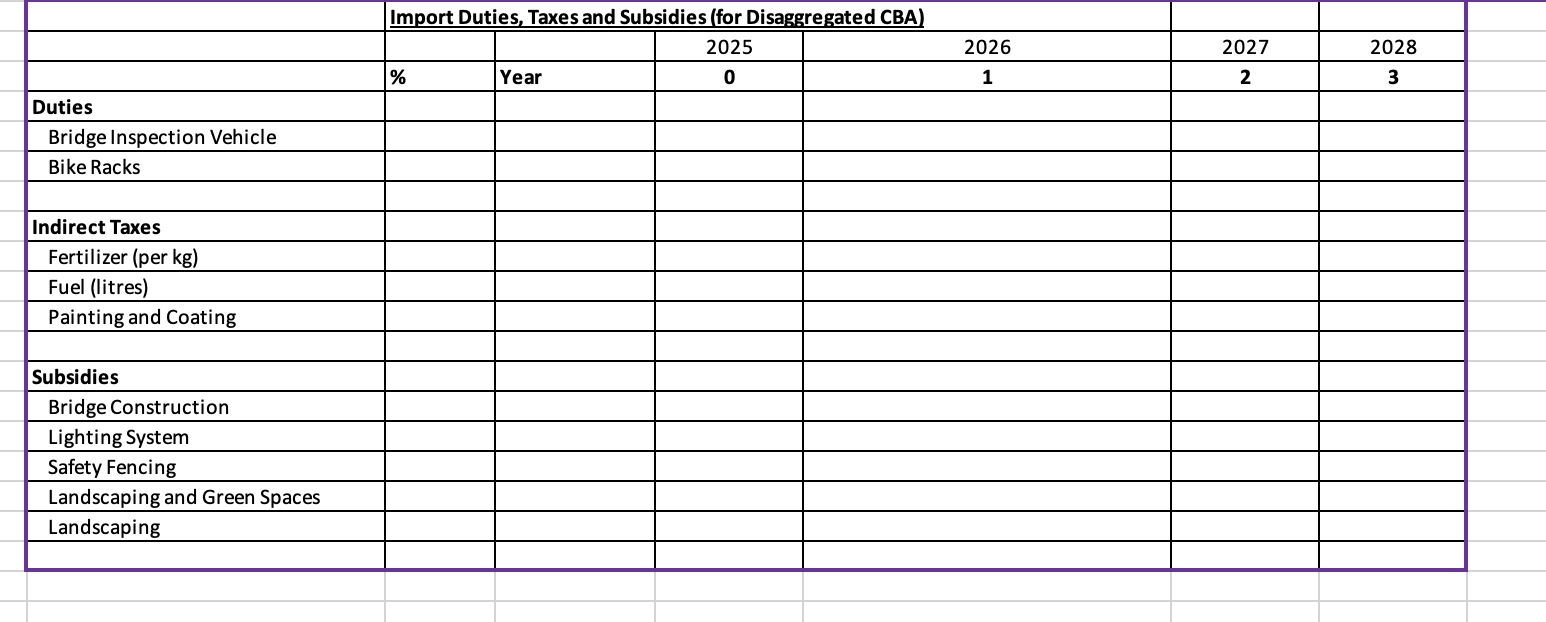
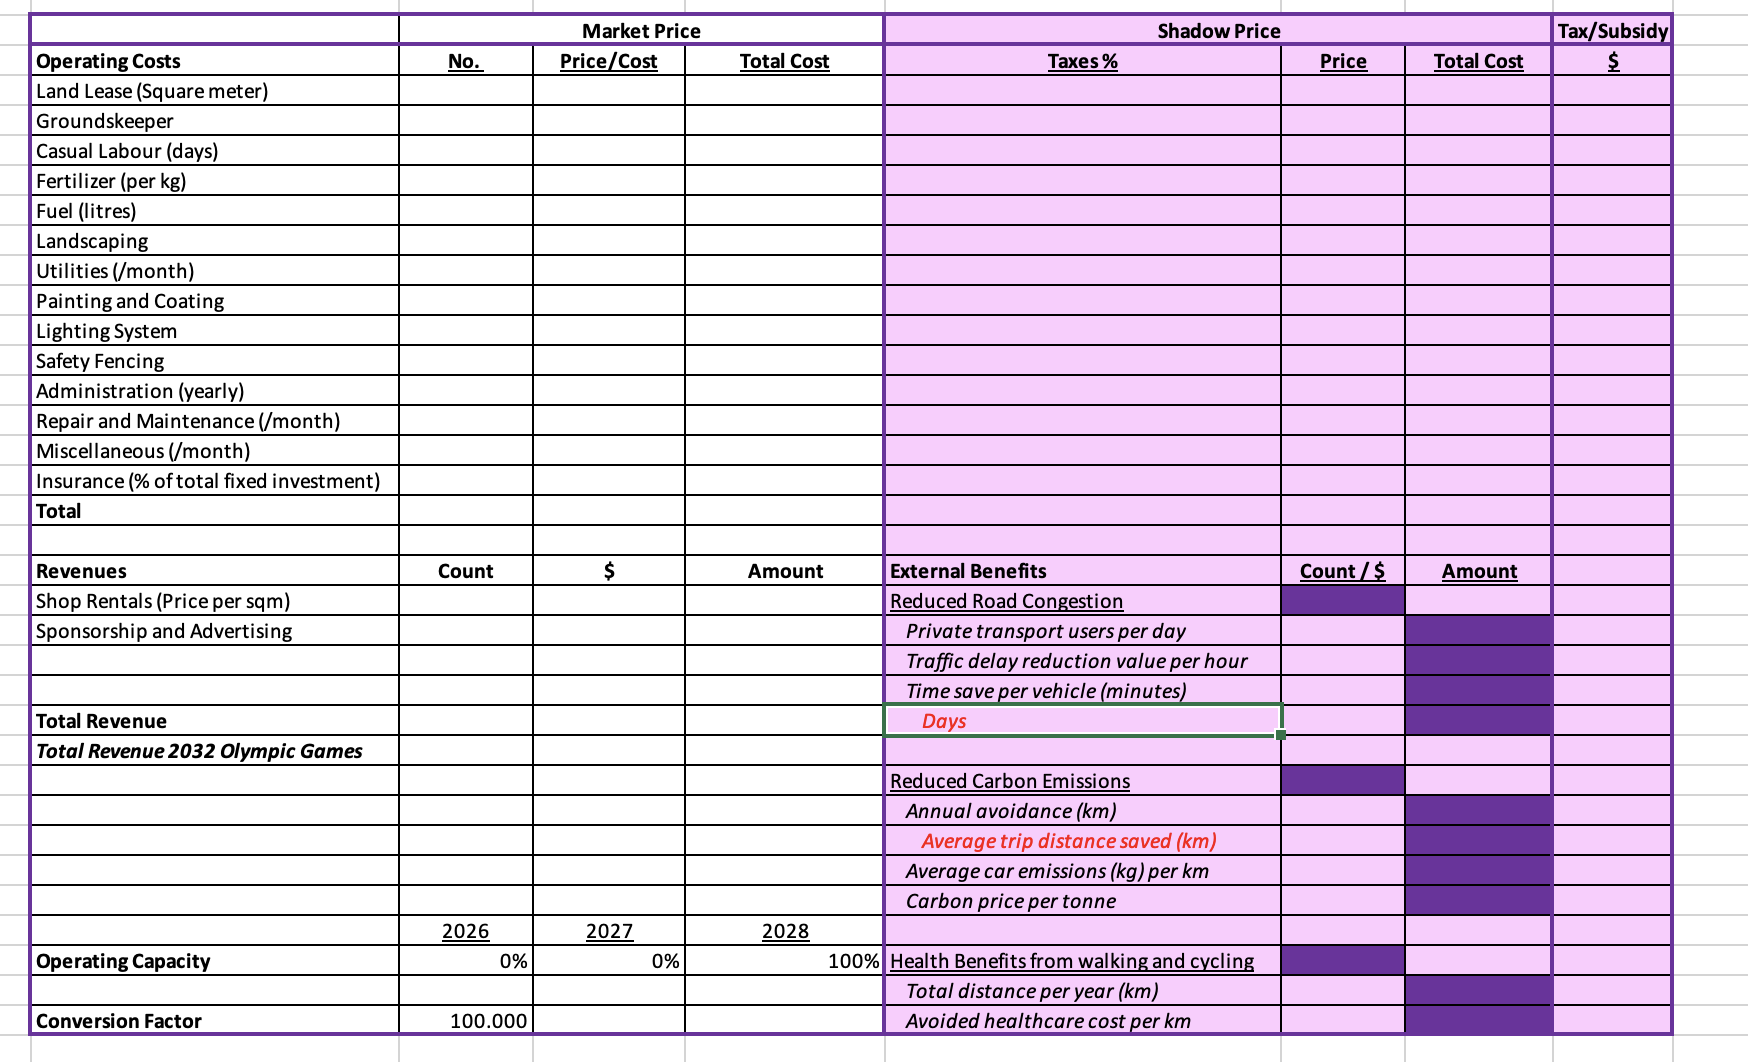
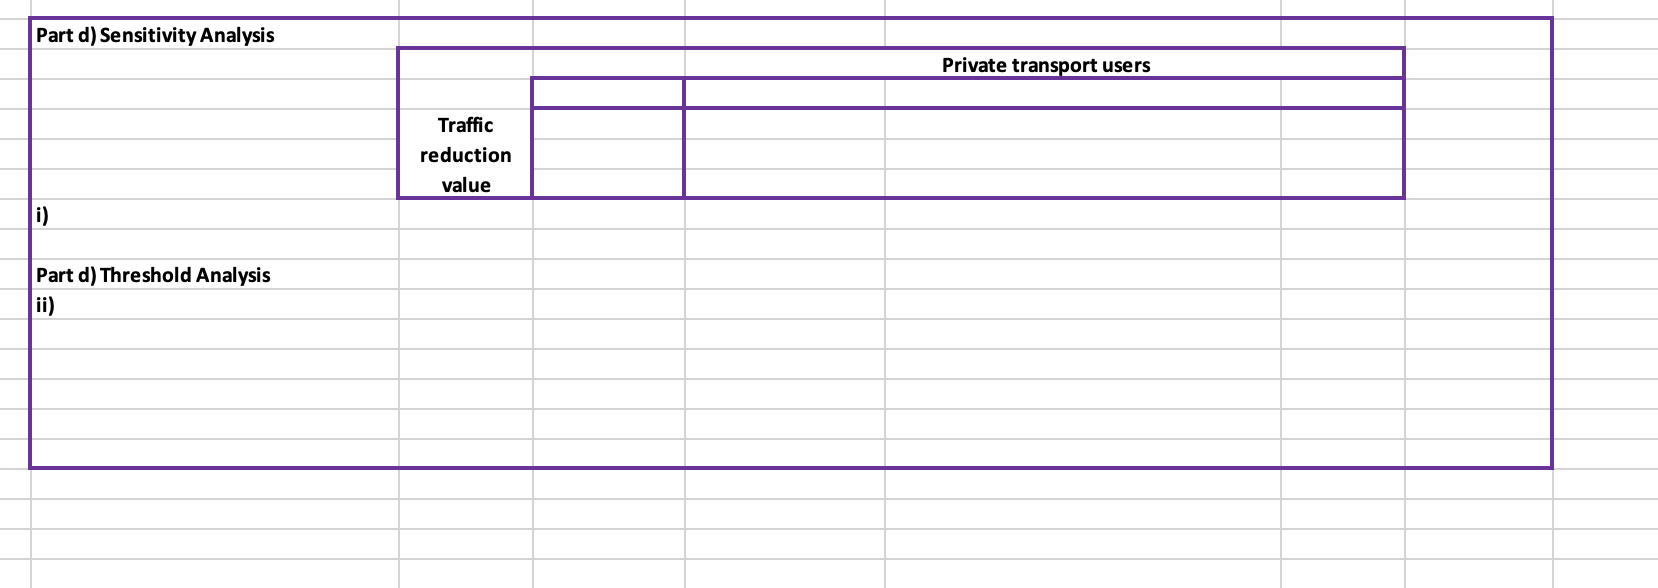
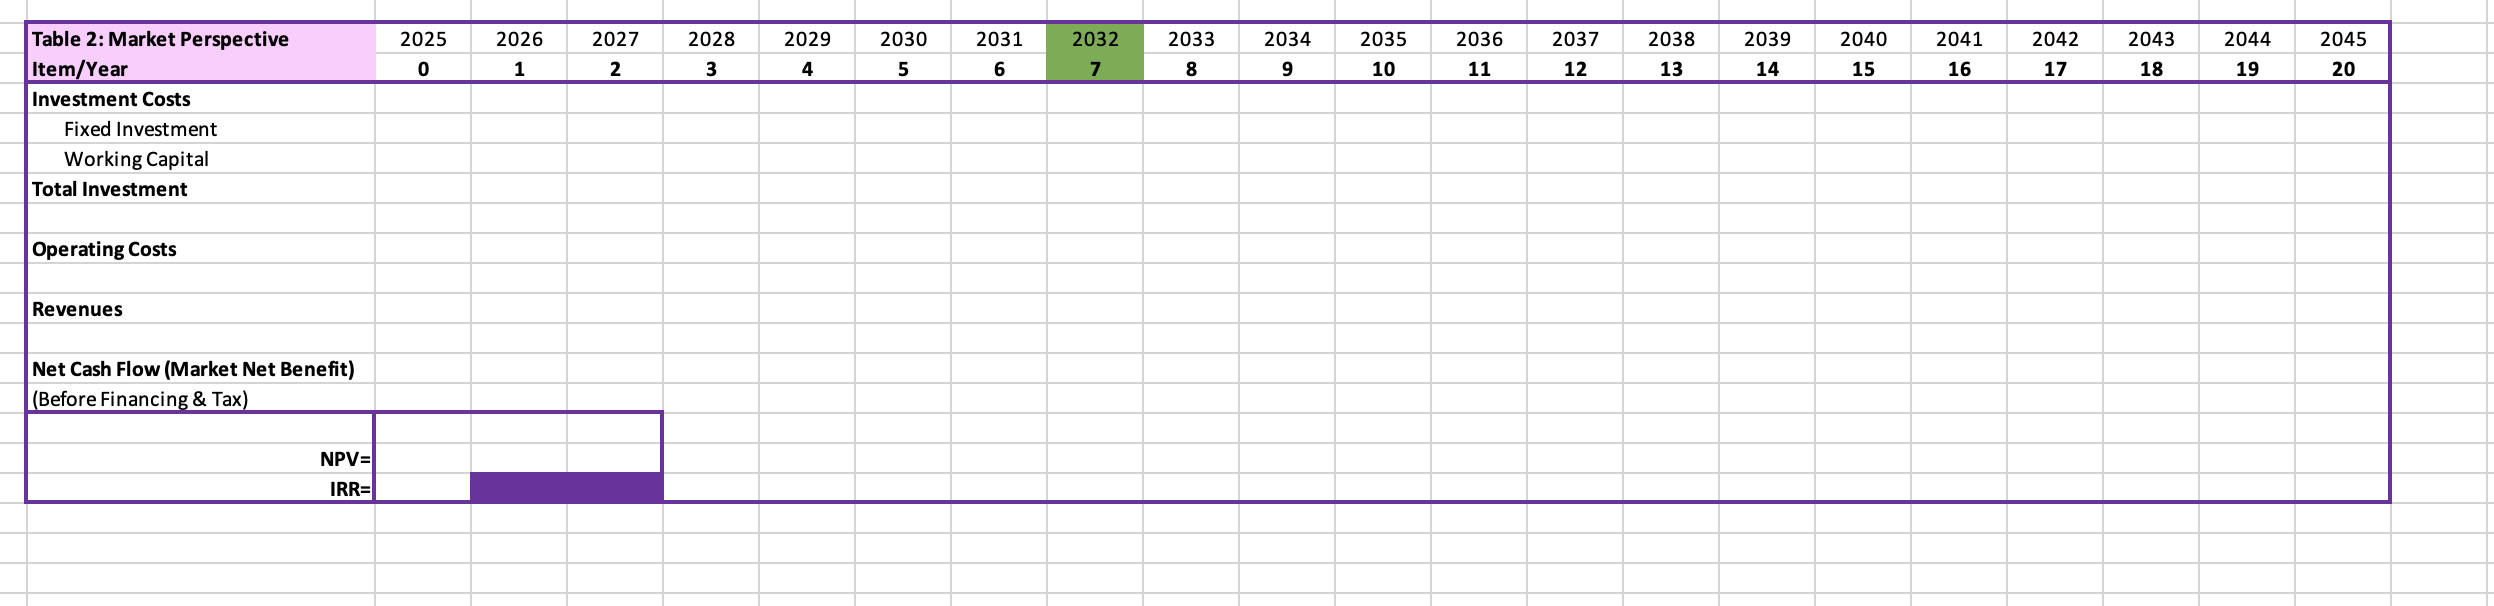
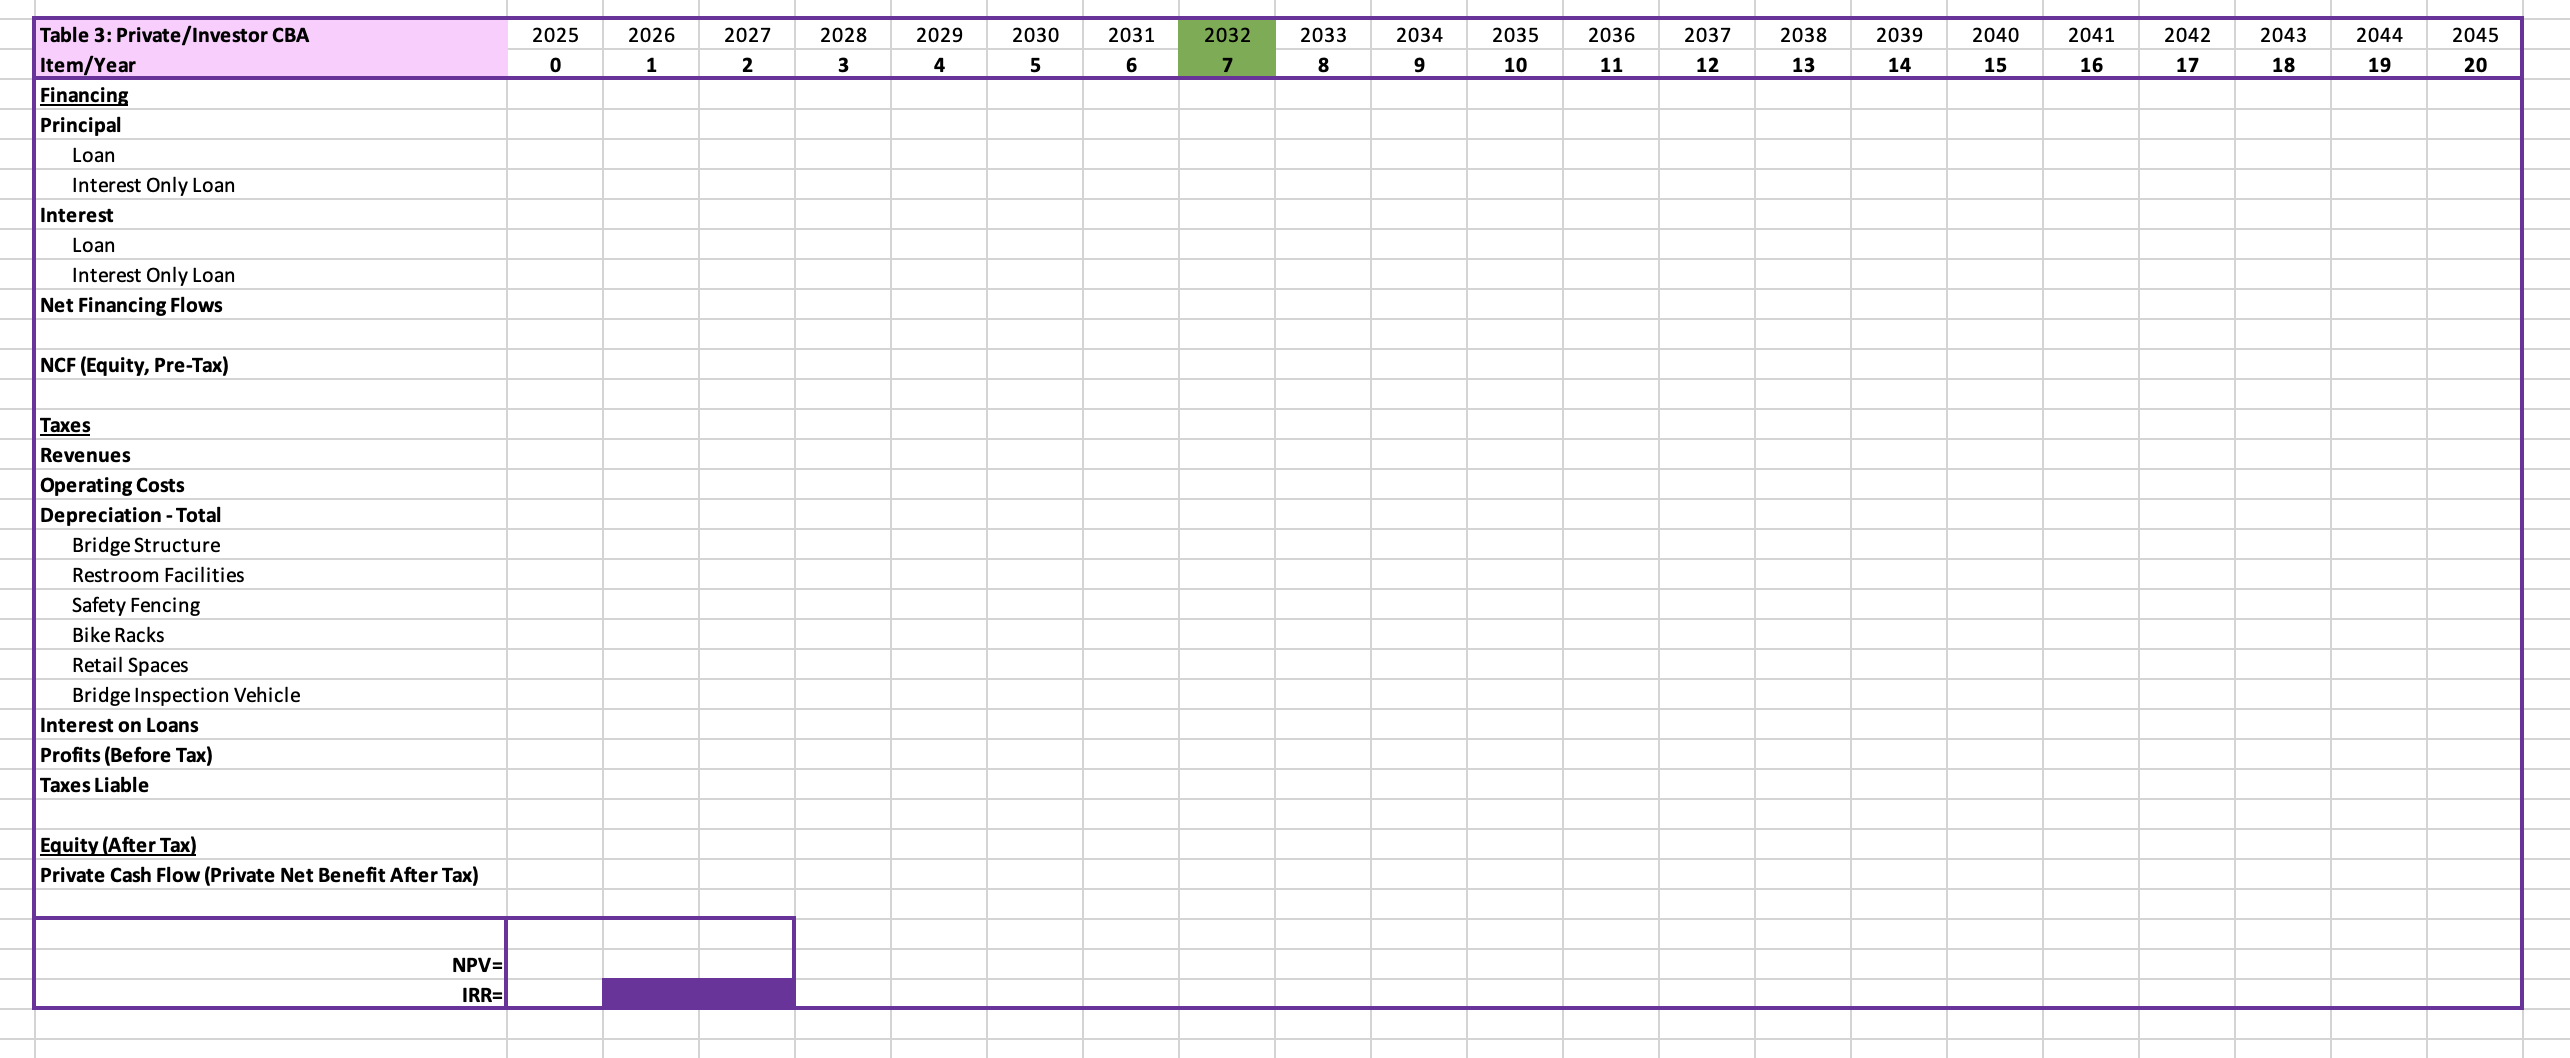
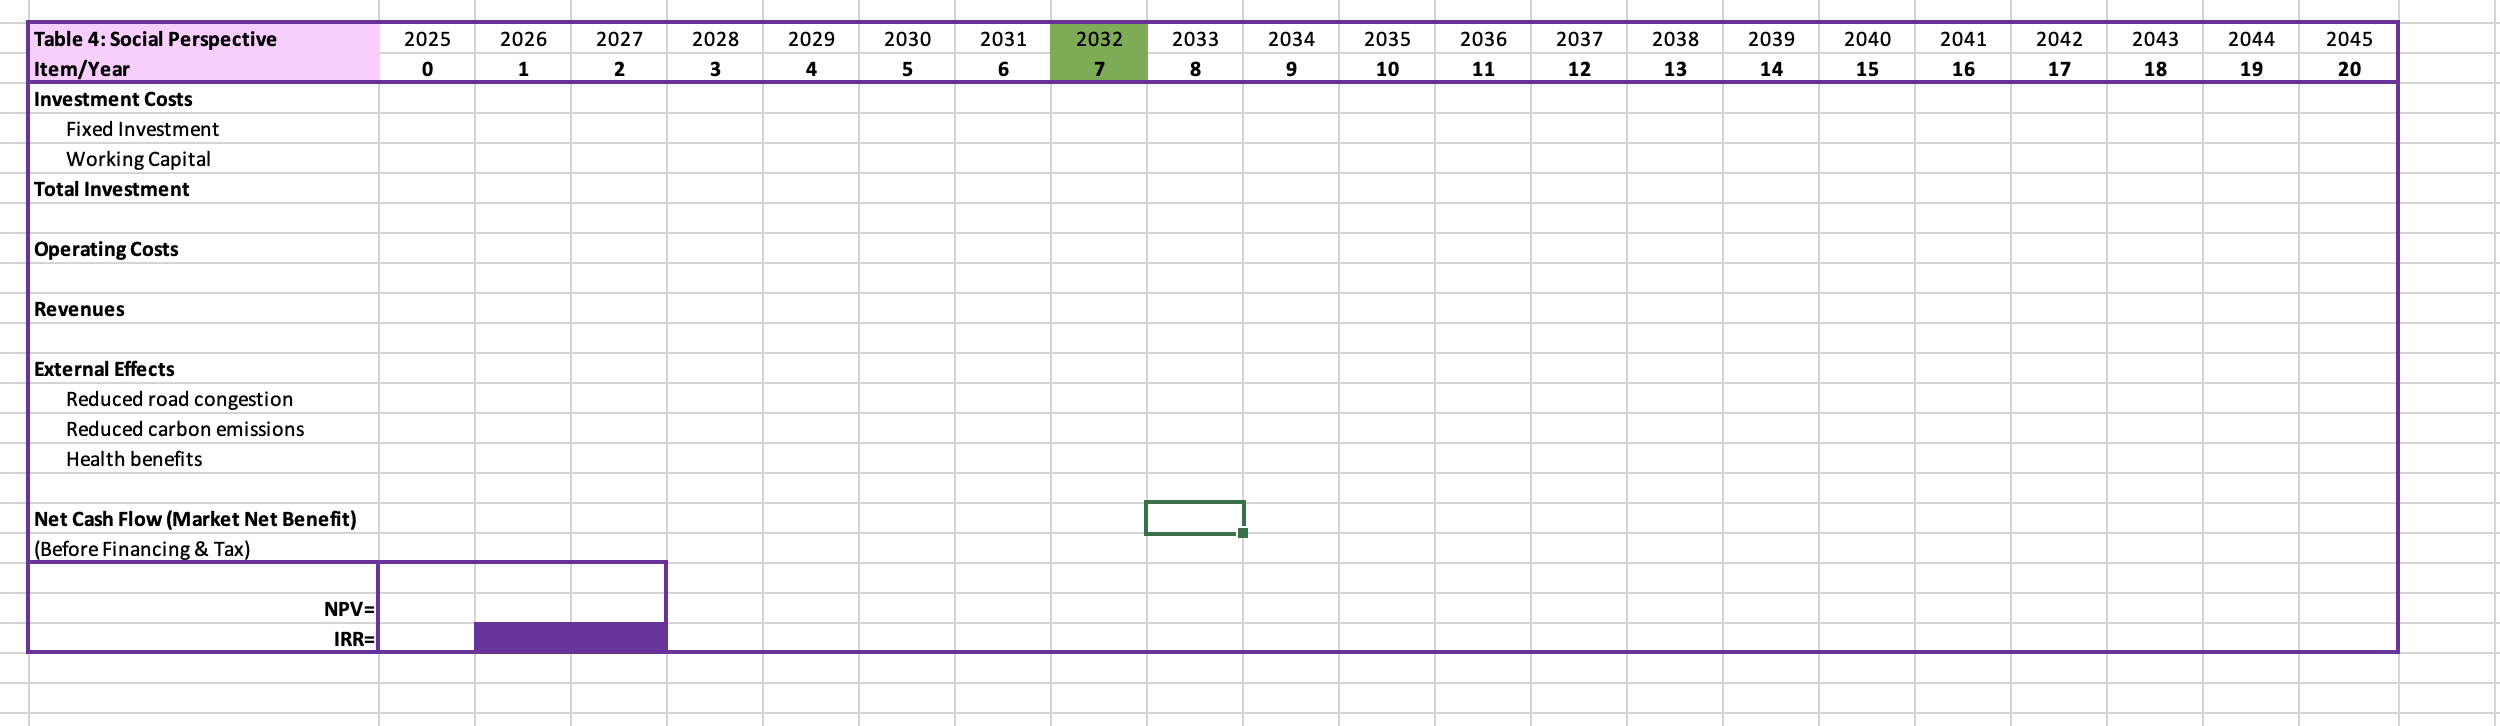
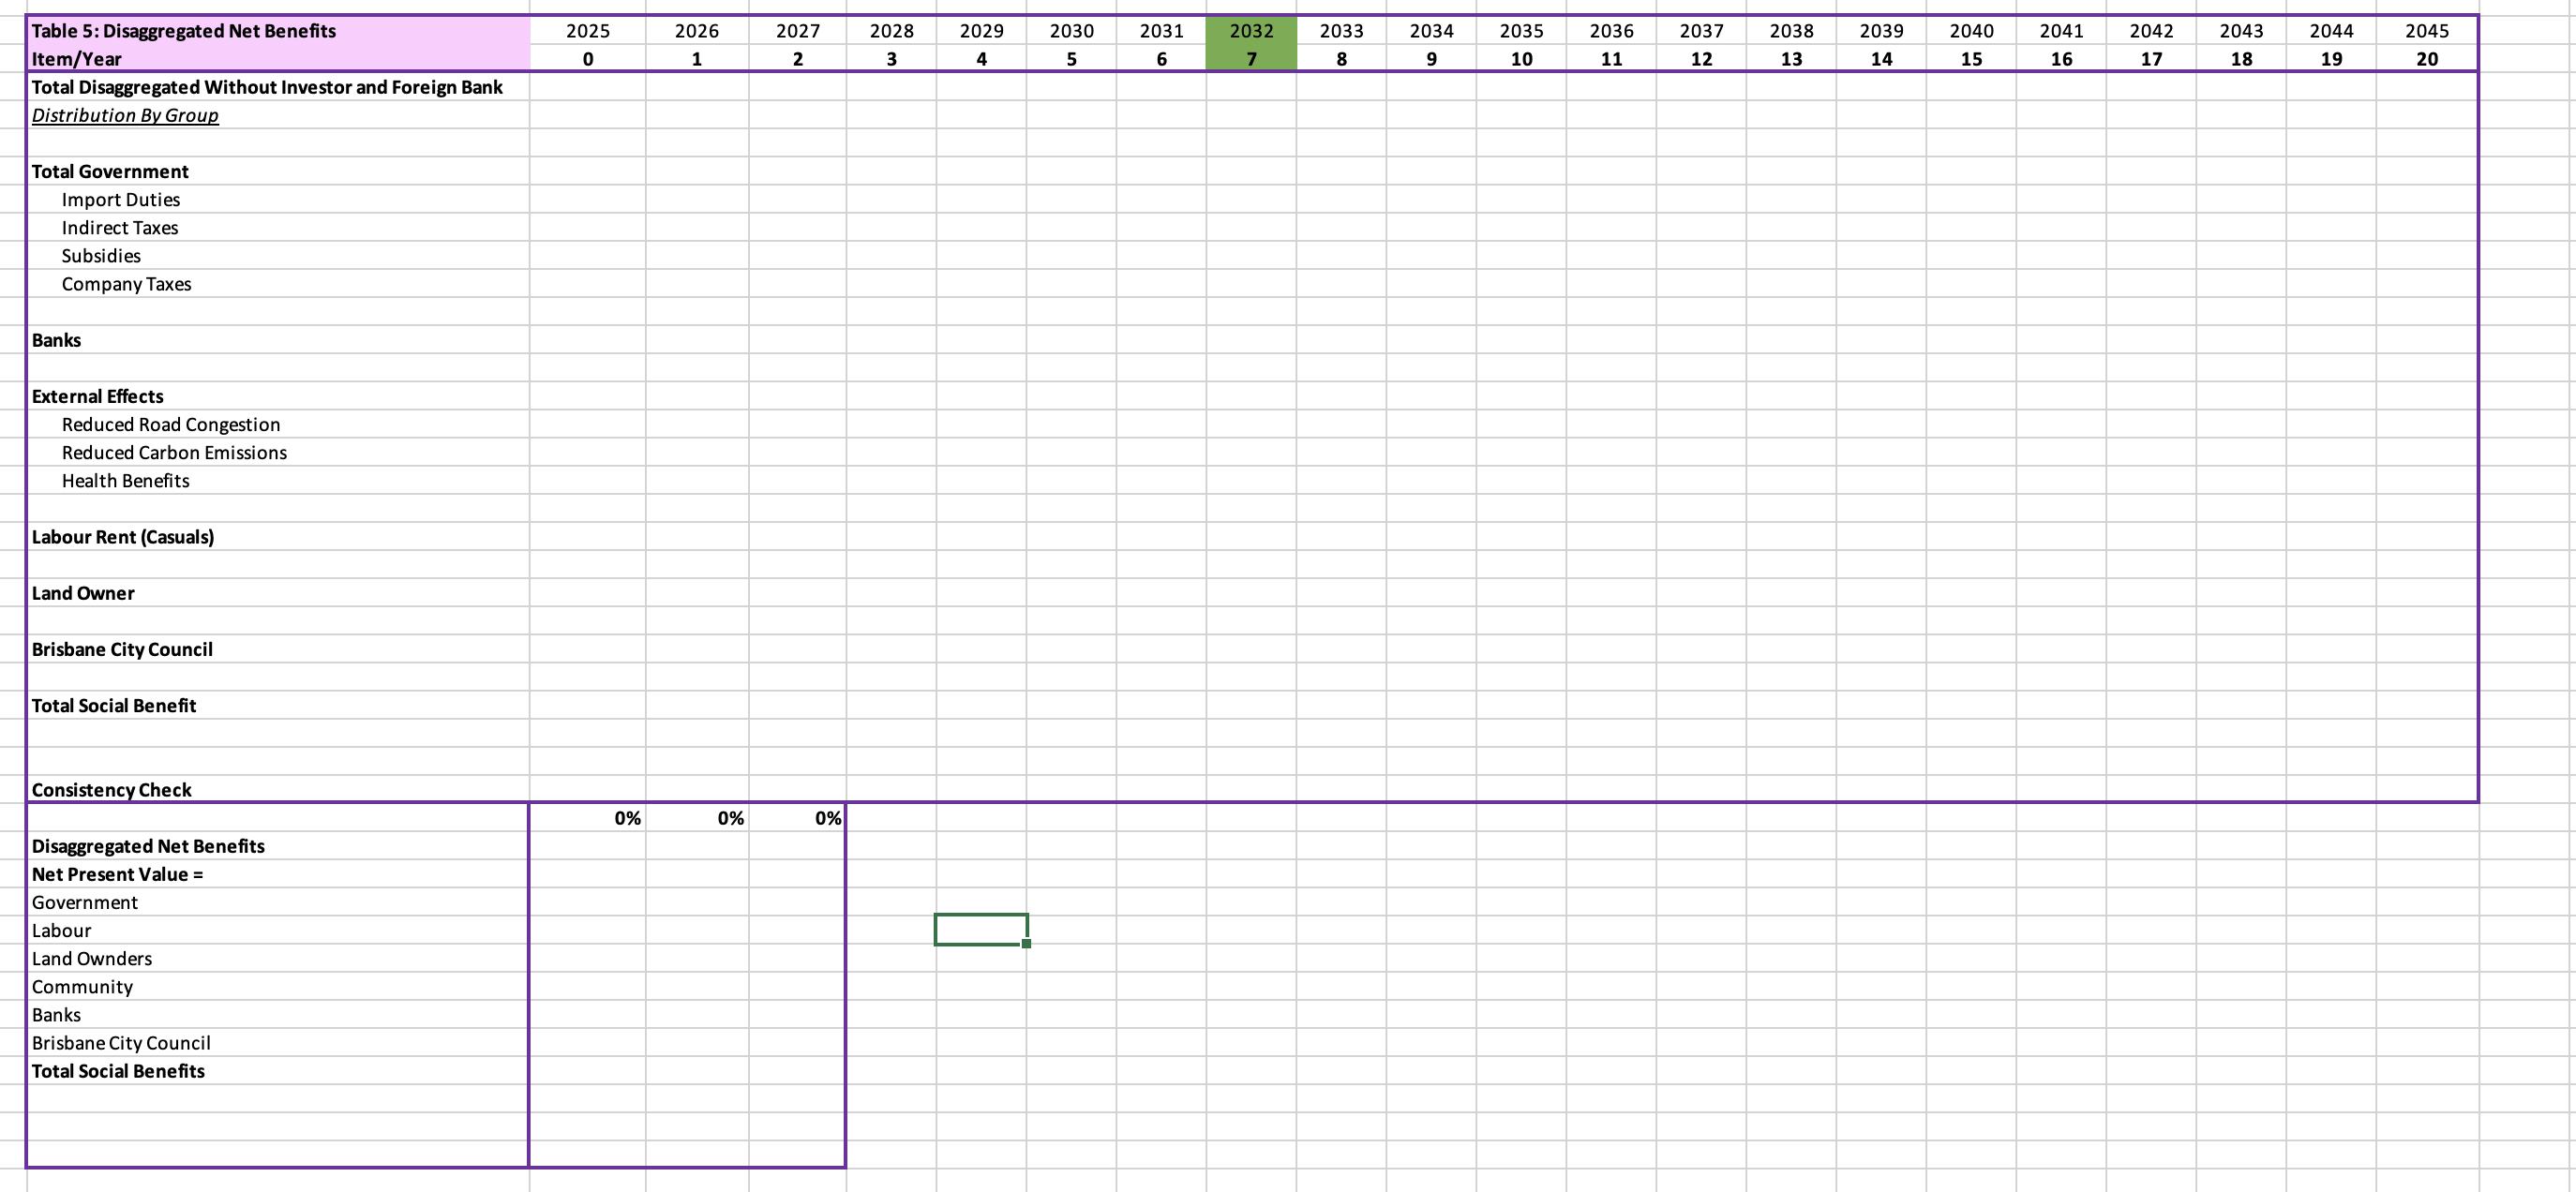
CREATE CHANGE Part 1- Spreadsheet Task 30 marks (15%) [Use the template Excel File on the BB website] a) Market and Investor Analysis The proposed development of the green bridge represents a significant investment in enhancing connectivity and promoting sustainable transport within the community. This project aims to create a vital link for pedestrians and cyclists, encouraging active travel while reducing reliance on motor vehicles. To realise this vision, the council has outlined a comprehensive plan that includes the construction of the bridge and essential amenities to support its operation. Before commencing the development, the council recognises the necessity of seeking legal advice to ensure compliance with all relevant laws, regulations, and contractual obligations. This legal consultation is projected to incur costs of $95,000. Alongside these legal fees, the council will invest in critical infrastructure, including the main construction cost of the bridge at $12,000,000, restroom facilities at a cost of $50,000, a lighting system for safety at $65,000, and safety fencing valued at $125,000. Additionally, bike racks will be installed at a cost of $50,000. A key component of the project involves the construction of three retail spaces, with a construction cost of $75,000 per lot, providing opportunities for local businesses and enhancing community engagement. Further to this, to create a welcoming environment, the council plans to enhance the surrounding landscape with green spaces, allocating $150,000 for landscaping in 2026. Additionally, the council will need to purchase the following items in 2026: - One complete set of maintenance tools to assist in the upkeep of the site at a total cost of $5,000. - Abridge inspection vehicle at the cost of $75,000. - 200 litres of fuel at $2.30 per litre to initially fuel the worksite vehicle. - 100 kilograms of fertiliser at $19.00 per kilogram for the green plants landscape. - 50% of the total area of 3,200 square meters will be painted and coated at a cost of $150 per square meter. As part of the project, the council will need to invest in working capital in 2027 to assist in maintenance of the facilities. The working capital items have been provided in Table 1. Item Units Price Per Unit Fuel (litre) 100 $2.30| Fertilizer (per kg) 80 $19.00 Landscaping 1 $85,000.00| Painting and Coating 3200 $150| Table 1: Working Capital In addition to the working capital, the council expects the following operating costs: Item Units Price Per Unit Utilities (/month) 12 $2,500 Painting and Coating 3200 $120| Repair & Maintenance (/month) 12 $150 Miscellaneous 12 $1,000 Fuel (litres) 150 $2.30| Fertilizer (per kg) 120 $19.00 Table 2: Operating Costs CREATE CHANGE Further to the information above, it is expected that 25% of the safety features, including lighting and fencing, will need to be replaced every year, and the facility will incur a yearly administration cost of $9,200. To ensure the maintenance of a vibrant and sustainable landscape surrounding the green bridge, the council will incur an annual operating cost of $25,000. This investment is crucial for the upkeep of green spaces, including regular landscaping services, plant care, and the management of any ecological features integrated into the project. The local council owns most of the land around the proposed green bridge; however, it will also need to lease additional land on both sides of the bridge in St Lucia and West End to accommodate the project. The land is not viable for other development uses, so the council has reached an agreement with the owner to rent it for $2,250 per square meter, with payment to be made once the bridge is fully operational. The total area to be rented is 250 square meters, and this land will be leased for the duration of the project. For the upkeep of the facility, the council's expected wage expenses include: - One groundskeeper with a salary of $85,000 per year. - Three casual workers who are expected to work 35 days of the year (each), on average. Each day of casual labour is expected to cost $200 per worker. Insurance premiums to cover liability, property damage, and other perceivable risks of the facility. The premium amount is 2.5% of total fixed investment, this including the additional investment in 2026. The anticipated revenue for the green bridge project encompasses several key components: i. Shop Rental Income: The project will include rental space for shops, charging $75 per square meter per week for each lot, which is sized at 50 square meters. This rental income will provide a steady revenue stream and encourage local businesses to thrive in the community. ii. Sponsorship and Advertising Revenue: The green bridge project is also expected to generate substantial income through sponsorship and advertising, with an estimated revenue of $2,100,000. This income will be vital in supporting the ongoing operations and maintenance of the project while promoting local businesses and organizations. Revenue During the Olympic Games 2032: It is anticipated that the total yearly revenue will triple during the Olympic Games 2032, as the increased foot traffic and heightened visibility will attract more visitors and sponsorship opportunities, significantly boosting income during this period. It is assumed that revenue will be changed back to normal afterwards. To finance the initial investment costs, the council will take out a loan of $3,000,000 at an interest rate of 4.5% per annum. The loan will have a 12-year term starting from 2026. Additionally, in 2028 the council will take out an interest only loan of $500,000 as a contingency for any unexpected costs. This loan will have a term of 5 years with repayments starting in 2029 and an interest rate of 9.5% per annum. For depreciation purposes, only the following assets are eligible to be depreciated: [Asset Life Bridge Structure 20 Restroom Facilities 20 [Safety Fencing 10 Bike Racks 10 Retail Spaces 20 Bridge Inspection Vehicle 8 Table 3: Depreciation Note that all assets are depreciated starting in 2026 with the exception of the bridge inspection vehicle. As bridge inspection vehicle is purchased in 2026, depreciation must begin in 2027. Other assets purchased as part of the initial capital investment are not eligible for depreciation. The tax rate on profits is 30%. Assume the salvage value for all investment costs is 10% of the initial fixed investment cost plus 10% of the additional investment cost (for capital purchased in year 2026). The green bridge project is expected to be under construction with no access until fully operational by the year 2028, setting the stage for these revenue streams to commence and grow in anticipation of the Olympic Games. Using a conversion factor of 100,000 and the information above, you have been asked to calculate the following: i) The IRR and NPV for the Market Analysis at a 5%, 10% and 15% real discount rate. ii) The IRR on equity and NPV for the business at a 5%, 10% and 15% real discount rate for the Investor Analysis. b) Social Analysis You now need to consider the social CBA. Due to taxes, duties, and subsidies you are required to calculate the relevant shadow prices for the following: Input Item PPercentage |Duties*: - Bridge Inspection Vehicle 110% - Bike Racks 10% [Subsidies: - Lighting System 20% - Safety Fencing 110% Taxes: - Fertilizer (per kg) 10% - Fuel (litres) 10% - Painting and Coating 10% Table 4: Taxes and Subsidies *remember that duties are only paid once. In addition to the information presented in Table 4, the council is set to receive a subsidy from the State government to support the development of the green bridge in preparation for the 2032 Olympics. It is anticipated that the State government will offer a 30% subsidy for the construction of the bridge. Furthermore, the government will provide a 20% subsidy for the landscaping and green spaces, aimed at enhancing environmental sustainability and the overall aesthetics of the infrastructure project. It is also noted that land has an opportunity cost of $0 and the opportunity cost of labour is 60% of the market wage for casual workers. The groundskeeper is employed from elsewhere and should be costed at the market wage. To estimate the external benefits of the green bridge project you consider the following benefits: 1) The Department of Transport and Main Roads estimated that the project will reduce the average number of private transport users in the suburb by 750 per day, potentially saving 4 minutes per vehicle. The traffic delay reduction value is estimated at $20 per hour. 2) Given the average trip distance saved in the suburb is 3 km, the annual avoidance can be measured by multiplying the number of reduced private transport users per day, the average trip distance, and the number of days per year. 3) This reduction in private transport also impacts carbon emissions. If the average car emissions can be reduced by 0.19 kg per km, calculate the annual reduction in carbon emissions by using the carbon price per tonne. You are required to search for relevant literature and justify the proper carbon price to be used. 4) The Australian Institute of Health and Welfare (AIHW) estimated that the average avoided healthcare cost per km is $3.20 for both cyclists and pedestrians. If the best estimation is that there are 1,200 individuals (cyclists and walkers) benefiting from this green project per day, with an average distance of 3 km per person, calculate the total health benefits per year from the impact of this green bridge. i) Building on the spreadsheet completed in a), calculate the NPV and IRR of the Social Cost Benefit Analysis using a 5%, 10% and 15% discount rate. c) Disaggregated Social Analysis Now, as part of the Cost-Benefit Analysis (CBA), you would like to break down the benefits to various stakeholders involved in the green bridge project. In this analysis, you will separate the benefits to the investor of city council from the benefits to society. This includes considering stakeholders with standing, such as landowners, labour, banks, city council and government, to disaggregate and allocate the benefits to subgroups involved in the project. Using the template identify: i) The NPV for the total disaggregated group of interest using a 5%, 10% and 15% discount rate. ii) The NPV for each remaining stakeholder group using a 5%, 10% and 15% discount rate. d) Sensitivity Analysis Now as part of the cost-benefit analysis, the local council is interested in evaluating the assumptions and how sensitive or insensitive the results are to the best guess inputs. Specifically, the council would like to answer the following questions: i) There are two key inputs that are uncertain regarding the expected external benefits from reducing road congestion in the suburb: the number of avoided private transport users and the traffic delay reduction value. The council would like to see how the Net Present Value (NPV) changes for the social analysis at a 5% discount rate. Allow the number of private transport users to vary around 750 by 20%, and the traffic reduction value to vary around $20 by 12.5% from the best estimate. Please comment on the results. ii) The council aims to achieve a Net Present Value (NPV) of 1.2 million dollar at a 5% discount rate to maximise the benefits from shop rentals. Use the \"Goal Seek\" function to determine the shop rental fee that should be charged to meet this target. Table 1: Key Variables Market Price Shadow Price Tax/Subsidy Initial Investment Cost No. Price/Cost Total Cost Taxes % Price Total Cost S Fixed Investment in 2025 Bridge Construction Restroom Facilities Legal and Compliance Costs Lighting System Safety Fencing Bike Racks Retail Spaces Construction Total Additional Initial Investment in 2026 Landscaping and Green Spaces Fertilizer (per kg) Maintenance Tools Bridge Inspection Vehicle Fuel (litres) Painting and Coating Total Salvage Value Working Capital (Starts in 2027) Landscaping Fertilizer (per kg) Fuel (litres) Painting and Coating Total Depreciation Life Amount Financing Amount Interest Life (years) Bridge Structure Loar Restroom Facilities Interest Only Loan in 2028 Safety Fencing Bike Racks Discount Rate = Retail Spaces Tax Rate on Profits Bridge Inspection VehicleImport Duties, Taxes and Subsidies (for Disaggregated CBA) 2025 2026 2027 2028 % Year 0 1 2 3 Duties Bridge Inspection Vehicle Bike Racks Indirect Taxes Fertilizer (per kg) Fuel (litres) Painting and Coating Subsidies Bridge Construction Lighting System Safety Fencing Landscaping and Green Spaces LandscapingMarket Price Shadow Price Tax/Subsidy Operating Costs No. Price/Cost Total Cost Taxes% Price Total Cost S Land Lease (Square meter) Groundskeeper Casual Labour (days) Fertilizer (per kg Fuel (litres) Landscaping Utilities (/month) Painting and Coating Lighting System Safety Fencing Administration (yearly) Repair and Maintenance (/month) Miscellaneous (/month) Insurance (% of total fixed investment) Total Revenues Count Amount External Benefits Count / $ Amount Shop Rentals (Price per sqm) Reduced Road Congestion Sponsorship and Advertising Private transport users per day Traffic delay reduction value per hour Time save per vehicle (minutes) Total Revenue Days Total Revenue 2032 Olympic Games Reduced Carbon Emissions Annual avoidance (km) Average trip distance saved (km) Average car emissions (kg) per km Carbon price per tonne 2026 2027 2028 Operating Capacity 0% 0% 100% Health Benefits from walking and cycling Total distance per year (km) Conversion Factor 100.000 Avoided healthcare cost per km\fTable 2: Market Perspective 2025 2026 2027 Item/Year 0 1 2 Investment Costs Fixed Investment Working Capital Total Investment Operating Costs Revenues Net Cash Flow (Market Net Benefit) 2028 3 2029 4 2030 5 2031 6 2033 8 2034 9 2035 10 2036 11 2037 12 2038 13 2039 14 2040 15 2041 16 2042 17 2043 18 2044 19 2045 20 Table 3: Private/Investor CBA 2025 2026 Item/Year o 1 Financing Principal Loan Interest Only Loan Interest Loan Interest Only Loan Net Financing Flows NCF (Equity, Pre-Tax) Taxes Revenues Operating Costs Depreciation - Total Bridge Structure Restroom Facilities Safety Fencing Bike Racks Retail Spaces Bridge Inspection Vehicle Interest on Loans Profits (Before Tax) Taxes Liable uity (After Tax] Private Cash Flow (Private Net Benefit After Tax) 2027 2 2028 3 2029 4 2030 5 2031 6 2033 8 2034 9 2035 10 2036 11 2037 12 2038 13 2039 14 2040 15 2041 16 2042 17 2043 18 2044 19 2045 20 Table 4: Social Perspective 2025 2026 2027 Item/Year Investment Costs Fixed Investment Working Capital Total Investment Operating Costs Revenues External Effects Reduced road congestion Reduced carbon emissions Health benefits Net Cash Flow (Market Net Benefit) 2028 2029 2030 2031 2033 2034 2035 2036 2037 2038 2039 2040 2041 2042 2043 2044 2045 | Table 5: Disaggregated Net Benefits 2026 Item/Year 1 Total Disaggregated Without Investor and Foreign Bank Distribution By Group Total Government Import Duties Indirect Taxes Subsidies Company Taxes Banks External Effects Reduced Road Congestion Reduced Carbon Emissions Health Benefits Labour Rent (Casuals) Land Owner Brisbane City Council Total Social Benefit Disaggregated Net Benefits Net Present Value = Government Labour Land Ownders Brisbane City Council Total Social Benefits 2027 2 2028 3 2029 4 2030 5 2031 6 2033 8 2034 9 2035 10 2036 11 2037 12 2038 13 2039 14 2040 15 2041 16 2042 17 2043 18 2044 19 2045 20
Step by Step Solution
There are 3 Steps involved in it
1 Expert Approved Answer
Step: 1 Unlock
Question Has Been Solved by an Expert!
Get step-by-step solutions from verified subject matter experts
Step: 2 Unlock
Step: 3 Unlock
Students Have Also Explored These Related Finance Questions!