

Question: create data visualizations of the results that you would present to a project committee. Example A bar chart A study was performed on wear of
- create data visualizations of the results that you would present to a project committee. Example A bar chart
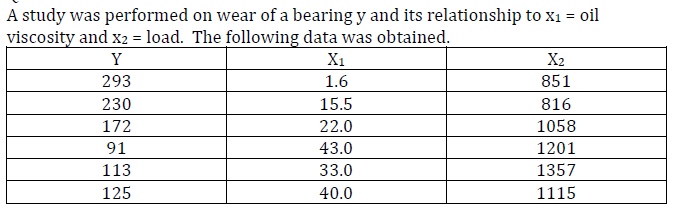
A study was performed on wear of a bearing y and its relationship to x1= oil viscosity and x2= load. The following data was obtained
Step by Step Solution
There are 3 Steps involved in it
1 Expert Approved Answer
Step: 1 Unlock

Question Has Been Solved by an Expert!
Get step-by-step solutions from verified subject matter experts
Step: 2 Unlock
Step: 3 Unlock