

Question: Create excel spread sheet. please give detail steps 3. Create an Excel table containing the data shown below: Number of weeks employed Number of cars
Create excel spread sheet. please give detail steps
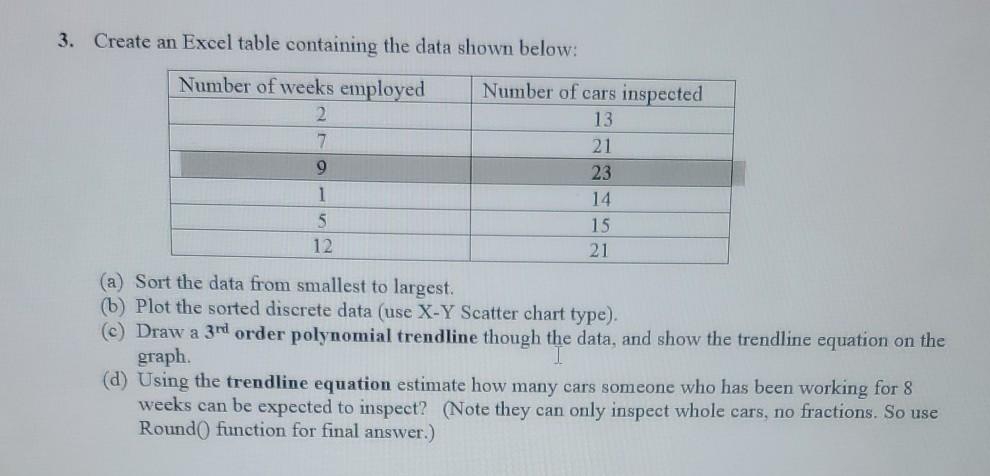
3. Create an Excel table containing the data shown below: Number of weeks employed Number of cars inspected 2 13 7 21 9 23 1 14 5 15 12 21 (a) Sort the data from smallest to largest. (b) Plot the sorted discrete data (use X-Y Scatter chart type). Draw a 3rd order polynomial trendline though the data, and show the trendline equation on the graph (d) Using the trendline equation estimate how many cars someone who has been working for 8 weeks can be expected to inspect? (Note they can only inspect whole cars, no fractions. So use Round function for final answer.)
Step by Step Solution
There are 3 Steps involved in it
1 Expert Approved Answer
Step: 1 Unlock

Question Has Been Solved by an Expert!
Get step-by-step solutions from verified subject matter experts
Step: 2 Unlock
Step: 3 Unlock