

Question: Create Expectation Management Matrix in a table format using the data from your previous Assignment # 5. Use as a sample Table 13-3 on page
Create Expectation Management Matrix in a table format using the data from your previous Assignment # 5. Use as a sample Table 13-3 on page 549 of Schwalbe's textbook. You could modify and extend with additional measures of success, such as achieving customers' satisfaction, exceeding ROI projections, and accomplishing great quality expectations. Write one page Memo to the stakeholders introducing to them the Expectation Management Matrix.
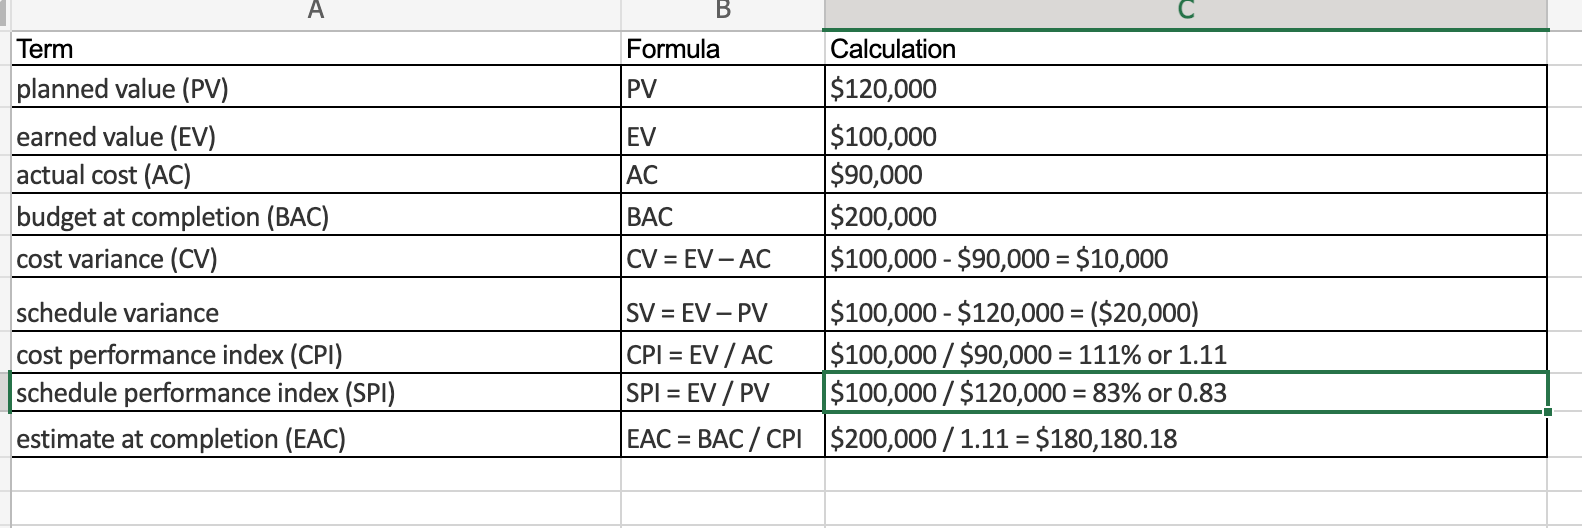
A Term planned value (PV) earned value (EV) actual cost (AC) budget at completion (BAC) cost variance (CV) schedule variance cost performance index (CPI) schedule performance index (SPI) estimate at completion (EAC) B Formula PV EV AC BAC |CV = EV- AC |SV = EV - PV CPI = EV / AC SPI = EV / PV |EAC = BAC/CPI Calculation $120,000 $100,000 $90,000 $200,000 $100,000 - $90,000 = $10,000 $100,000 - $120,000 = ($20,000) $100,000/$90,000 = 111% or 1.11 $100,000/$120,000 = 83% or 0.83 $200,000/1.11 = $180,180.18 A Term planned value (PV) earned value (EV) actual cost (AC) budget at completion (BAC) cost variance (CV) schedule variance cost performance index (CPI) schedule performance index (SPI) estimate at completion (EAC) B Formula PV EV AC BAC |CV = EV- AC |SV = EV - PV CPI = EV / AC SPI = EV / PV |EAC = BAC/CPI Calculation $120,000 $100,000 $90,000 $200,000 $100,000 - $90,000 = $10,000 $100,000 - $120,000 = ($20,000) $100,000/$90,000 = 111% or 1.11 $100,000/$120,000 = 83% or 0.83 $200,000/1.11 = $180,180.18
Step by Step Solution
There are 3 Steps involved in it

Get step-by-step solutions from verified subject matter experts