

Question: Create in C Program Consider a two-dimensional K by K grid-structure such as that shown in Figure 1(a). Each grid cell is either colored or
Create in C Program
Consider a two-dimensional K by K grid-structure such as that shown in Figure 1(a). Each grid cell is either colored or uncolored. A cell is colored with probability P and uncolored with probability 1.0P with the same value of P used throughout the entire grid. Here, we are primarily concerned with colored cells and how they cluster for different values of P. A colored cell A is said to be adjacent to another colored cell B if B is the cell immediately to the north, south, east, or west of A in the grid. Each cell has 4 adjacent cells (neighbors) except those along the edges of the grid which have only 2 or 3 neighbors. A colored grid can be represented as an undirected graph where each colored cell is represented by a vertex and a link between vertices indicates the corresponding cells are adjacent. For example, the graph shown in Figure 1(b) represents the grid structure shown in Figure 1(a). Here, we have labelled vertices with integers to uniquely identify them.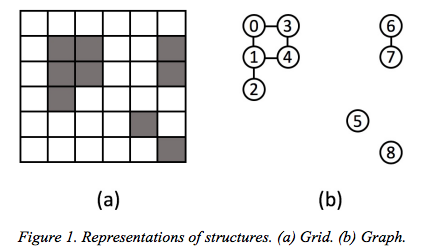
A connected component (or just component) is defined as a subgraph of the original graph where there is a path between every pair of vertices in the subgraph, and there are no edges between a vertex in the component and any other vertex not in the component. The largest component of a graph is the component with the largest number of vertices. For example, the structure shown in Figure 1 consists of four components of size 5, 2, 1 and 1, with the largest component containing 5 vertices. We are interested in the size of the components of the graph for different values of P. For example, it is clear that if P is close to 0.0 the graph will consist of mostly isolated, unconnected vertices and perhaps a few small clusters, so most components will have a size of perhaps 1 or 2 cells. On the other hand, if P is 1.0 or close to 1.0, the graph will consist of a single, large component of size N, where N is the number of vertices in the graph. Note that if P is small, the size of the largest component is largely independent of the size of the grid, but if P is large (close to 1.0) the size of the largest component increases with the size of the grid. These two situations might be referred to as phases. The goal of this assignment is to examine how the size of the components, especially the largest component, vary as P is increased from 0.0 to 1.0, i.e., how this system changes from one phase to the other. This assignment involves writing two programs. The first creates a grid, converts it to a graph, and stores the graph in a file. The second reads a graph file and computes statistics concerning the number and size of the components in the graph. Note that the second program should be a general graph analysis program that is able to analyze any graph, not just graphs that are produced based on grid structures. You will then conduct a series of computational experiments to study the relationship between component size and the parameter P.
Graph Generation (Create in C Program) The graph generation program should take as command line parameters (1) an integer K indicating the number of cells in one row/column of the square grid, (2) the probability parameter P (0
% graphgen 10 0.4 topology will execute your program called graphgen and create a 10x10 grid with 100 cells. Each cell of the grid will be colored with probability 0.4. The output file topology will hold the resulting graph in adjacency list format. Specifically, the first line of the file indicates the number of vertices in the graph, N, with vertices numbered 0, 1, 2, N-1. Each successive line indicates a vertex number V and a list of vertices that have a link connecting it with V. For example, the file for the graph shown in Figure 1(b) is shown below. 9 0 1 3 1 0 2 4 2 1 3 0 4 4 3 1 5 6 7 7 6 8 Note that if a vertex V has no links to other vertices, then that line of the file only contains V.
Graph Analysis The second program performs an analysis of the components of a graph. Specifically, the command line % components topology outfile
executes the graph analysis program components which uses the file called topology as input, computes the statistics listed below, and stores these results into the file outfile. The statistics that are computed are: 1. The number of components 2. The average size (number of vertices) in a component 3. The number of vertices in the largest component 4. A histogram indicating the distribution of component sizes. These values should be written to the file in this order. For example the graph in Figure 1(b) produces the results shown below indicating there are 4 components, the average component size is (5+2+1+1) / 4 or 2.25 vertices, the largest component has 5 vertices, and the component size histogram indicates there are 2 components of size 1, one of size 2, and 1 of size 5 and no components with the other sizes: 4 2.25 5 1 2 2 1 3 0 4 0 5 1 The main computation performed by the graph analysis program is to compute the size of the components in the graph. You should use either breadth first search (BFS) or depth first search (DFS) to compute the size of graph components.
0 3 6 14 7 Figure 1. Representations of structures. (a) Grid. (b) Graph 0 3 6 14 7 Figure 1. Representations of structures. (a) Grid. (b) Graph
Step by Step Solution
There are 3 Steps involved in it

Get step-by-step solutions from verified subject matter experts