

Question: CREATE IN EXCEL The key to completing this assignment is to take a careful look at Fig. 18-4 on page 222. This Pareto chart is
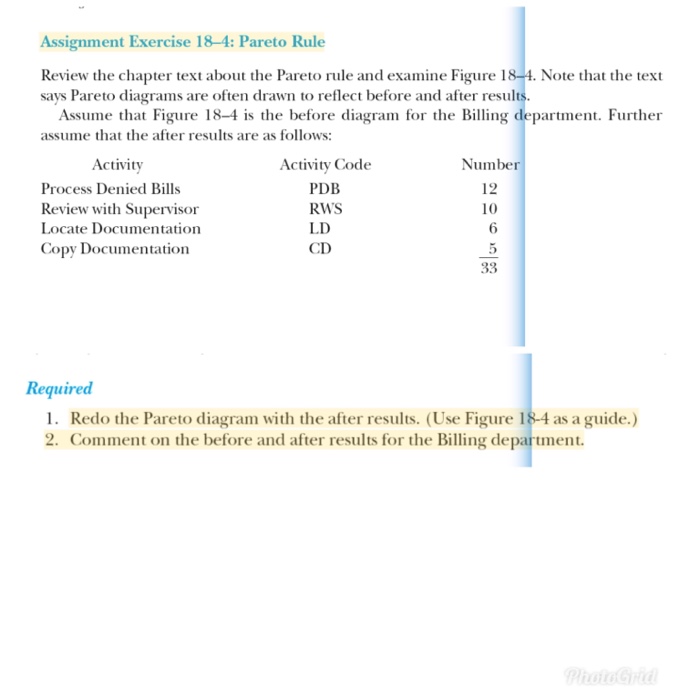
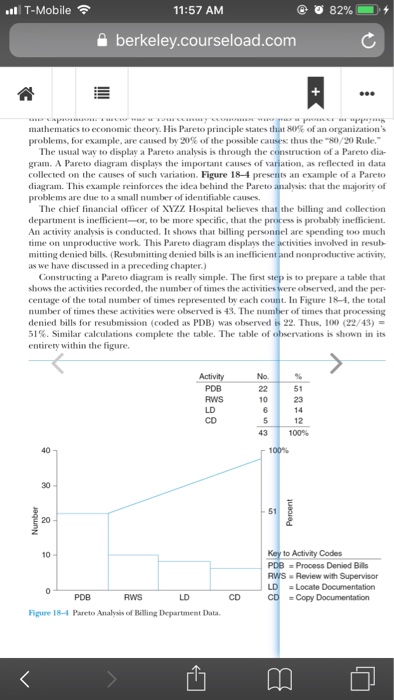
Assignment Exercise 18-4: Pareto Rule Note that the test Review the chapter text about the Pareto rule and examine Figure 184. says Pareto diagrams are often drawn to reflect before and after results. Assume that Figure 18-4 s the before diagram for the Billing department. Further assume that the after results are as follows Activity Process Denied Bills Review with Supervisor Locate Documentation Copy Documentation Activity Code PDB RWS LD CD Number 12 10 6 Required 1. Redo the Pareto diagram with the after results. (Use Figure 18-4 as a guide.) 2. Comment on the before and after results for the Billing department. Assignment Exercise 18-4: Pareto Rule Note that the test Review the chapter text about the Pareto rule and examine Figure 184. says Pareto diagrams are often drawn to reflect before and after results. Assume that Figure 18-4 s the before diagram for the Billing department. Further assume that the after results are as follows Activity Process Denied Bills Review with Supervisor Locate Documentation Copy Documentation Activity Code PDB RWS LD CD Number 12 10 6 Required 1. Redo the Pareto diagram with the after results. (Use Figure 18-4 as a guide.) 2. Comment on the before and after results for the Billing department
Step by Step Solution
There are 3 Steps involved in it

Get step-by-step solutions from verified subject matter experts