

Question: Create the data for the TIME variable and use Excel's IF function to code the data for the Q2, Q3, Q4, and MODEL dummy variables.
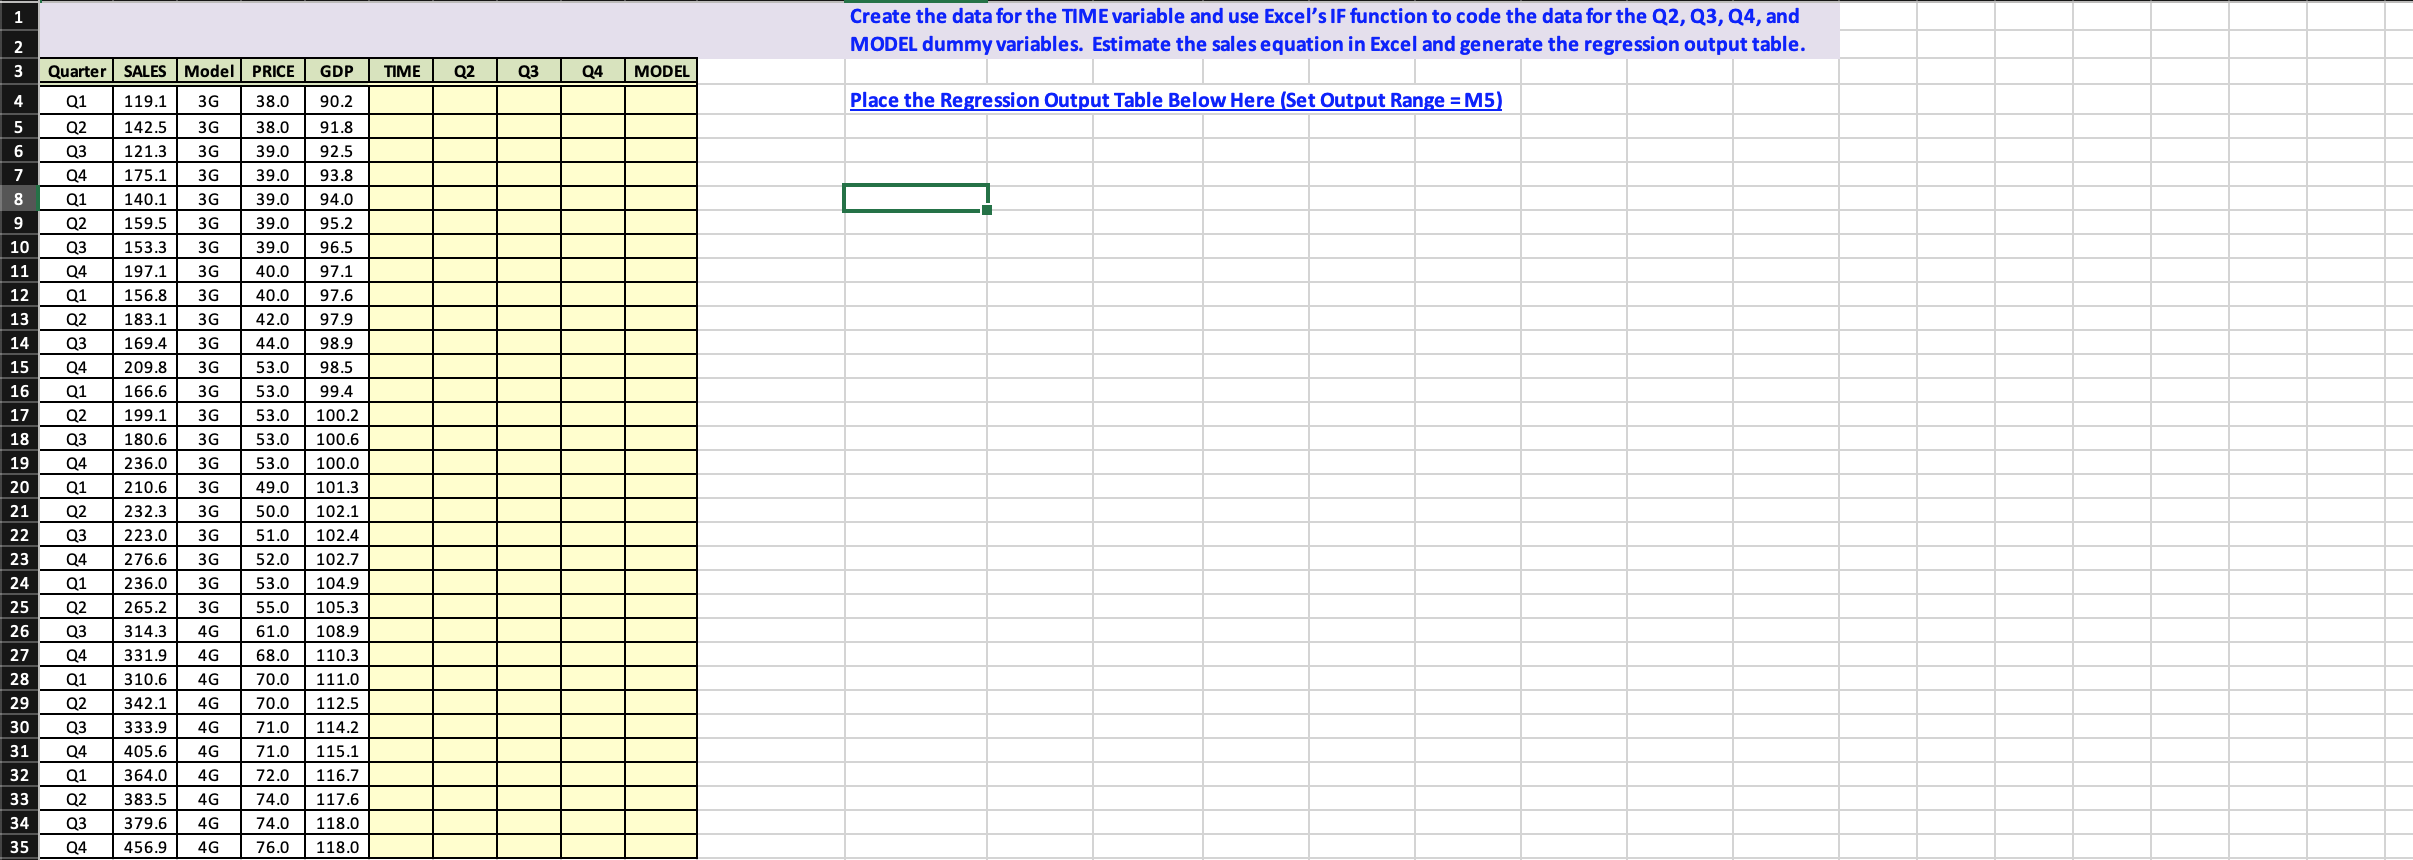

Create the data for the TIME variable and use Excel's IF function to code the data for the Q2, Q3, Q4, and MODEL dummy variables. Estimate the sales equation in Excel and generate the regression output table. Quarter SALES Model | PRICE GDP TIME Q2 Q3 Q4 MODEL Q 119.1 30 38.0 90.2 Place the Regression Output Table Below Here (Set Output Range = M5) Q2 142.5 3G 38.0 91.8 Q3 121.3 3G 39.0 92.5 Q4 175.1 3G 39.0 93.8 8 Q1 140.1 3G 39.0 94.0 Q2 159.5 3G 39.0 95.2 10 Q3 153.3 3G 39.0 96.5 11 Q4 197.1 3G 40.0 97.1 12 Q1 156.8 3G 40.0 97.6 13 Q2 183.1 3G 42.0 97.9 14 Q3 169.4 3G 44.0 98.9 15 Q4 209.8 3G 53.0 98.5 16 Q1 166.6 3G 53.0 99.4 199.1 3G 53.0 100.2 Q3 180.6 3G 53.0 100.6 Q4 236.0 3G 53.0 100.0 Q1 210.6 3G 49.0 101.3 Q2 232.3 3G 50.0 102.1 Q3 223.0 3G 51.0 102.4 Q4 276.6 3G 52.0 102.7 24 Q1 236.0 3G 53.0 104.9 25 Q2 265.2 3G 55.0 105.3 Q3 314.3 4G 61.0 108.9 Q4 331.9 4G 68.0 110.3 Q1 310.6 4G 70.0 111.0 Q2 342.1 4G 70.0 112.5 30 Q3 333.9 4G 71.0 114.2 31 Q4 405.6 4G 71.0 115.1 32 Q1 364.0 4G 72.0 116.7 33 Q2 383.5 4G 74.0 117.6 34 03 379.6 4G 74.0 118.0 35 04 456.9 4G 76.0 118.0
Step by Step Solution
There are 3 Steps involved in it

Get step-by-step solutions from verified subject matter experts