

Question: Create the data set using Python Prepare Data A. Create a data set with 100 feature vectors with the following attributes (features) as such: al
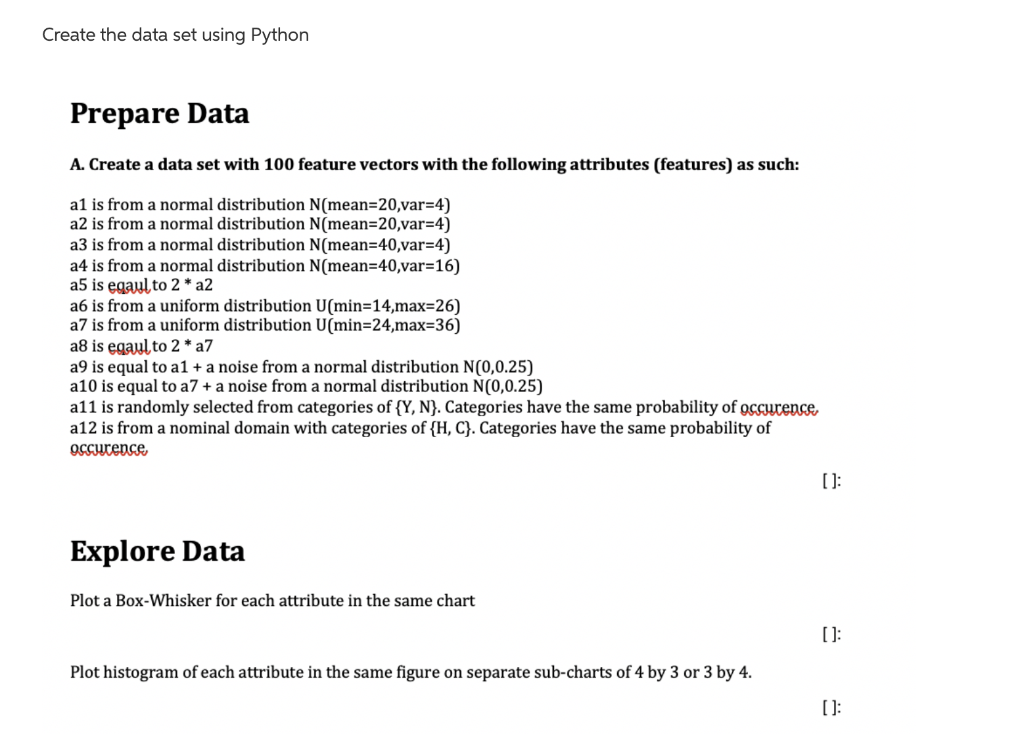
Create the data set using Python Prepare Data A. Create a data set with 100 feature vectors with the following attributes (features) as such: al is from a normal distribution N(mean=20,var=4) a2 is from a normal distribution N(mean=20,var=4) a3 is from a normal distribution N(mean=40,var=4) a4 is from a normal distribution N(mean=40,var=16) a5 is egaul to 2 * a2 a6 is from a uniform distribution U(min=14,max=26) a7 is from a uniform distribution U(min=24, max=36) a8 is egaul to 2 * a7 a9 is equal to a1 + a noise from a normal distribution N(0,0.25) a10 is equal to a7 + a noise from a normal distribution N(0,0.25) a11 is randomly selected from categories of {Y, N}. Categories have the same probability of occurence a12 is from a nominal domain with categories of {H, C}. Categories have the same probability of oscurence [ ]: Explore Data Plot a Box-Whisker for each attribute in the same chart 01: Plot histogram of each attribute in the same figure on separate sub-charts of 4 by 3 or 3 by 4. [ ]: Create the data set using Python Prepare Data A. Create a data set with 100 feature vectors with the following attributes (features) as such: al is from a normal distribution N(mean=20,var=4) a2 is from a normal distribution N(mean=20,var=4) a3 is from a normal distribution N(mean=40,var=4) a4 is from a normal distribution N(mean=40,var=16) a5 is egaul to 2 * a2 a6 is from a uniform distribution U(min=14,max=26) a7 is from a uniform distribution U(min=24, max=36) a8 is egaul to 2 * a7 a9 is equal to a1 + a noise from a normal distribution N(0,0.25) a10 is equal to a7 + a noise from a normal distribution N(0,0.25) a11 is randomly selected from categories of {Y, N}. Categories have the same probability of occurence a12 is from a nominal domain with categories of {H, C}. Categories have the same probability of oscurence [ ]: Explore Data Plot a Box-Whisker for each attribute in the same chart 01: Plot histogram of each attribute in the same figure on separate sub-charts of 4 by 3 or 3 by 4. [ ]
Step by Step Solution
There are 3 Steps involved in it

Get step-by-step solutions from verified subject matter experts