

Question: Create the OC Curve for the following sampling plan AND evaluate the Type I and Type II Risks at the AQL. NOTE: Your results must
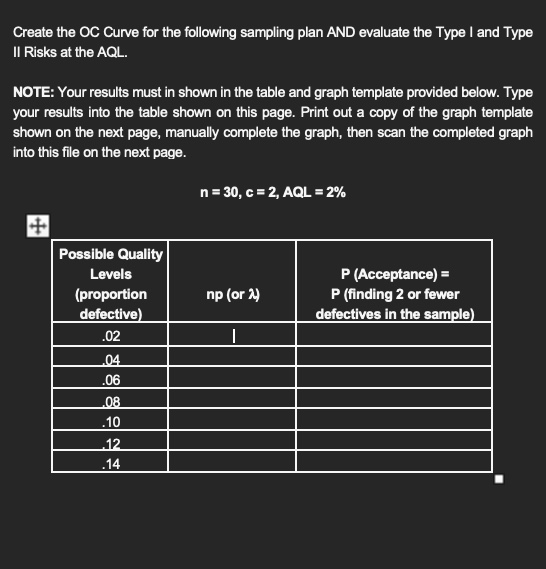
Create the OC Curve for the following sampling plan AND evaluate the Type I and Type
II Risks at the AQL.
NOTE: Your results must in shown in the table and graph template provided below. Type
your results into the table shown on this page. Print out a copy of the graph template
shown on the next page, manually complete the graph, then scan the completed graph
into this file on the next page.
AQL
Step by Step Solution
There are 3 Steps involved in it
1 Expert Approved Answer
Step: 1 Unlock

Question Has Been Solved by an Expert!
Get step-by-step solutions from verified subject matter experts
Step: 2 Unlock
Step: 3 Unlock