

Question: Create the two arrays in MATLAB, then write scripts to accomplish the listed below. Use the x-axis for R and y-axis for T. Your plots
Create the two arrays in MATLAB, then write scripts to accomplish the listed below. Use the x-axis for R and y-axis for T. Your plots should show the raw data as data symbols, and the fit polymonials as continuous curves.
A) Show the full matlab script
B) The code should show the two plots, each indicating the axes and the titles.
C)The script should show the coefficients of the fit polynomial in the command window
D)List the two polynomials
E)use polyval to calculate T when R=1.2E5 for both polynomials
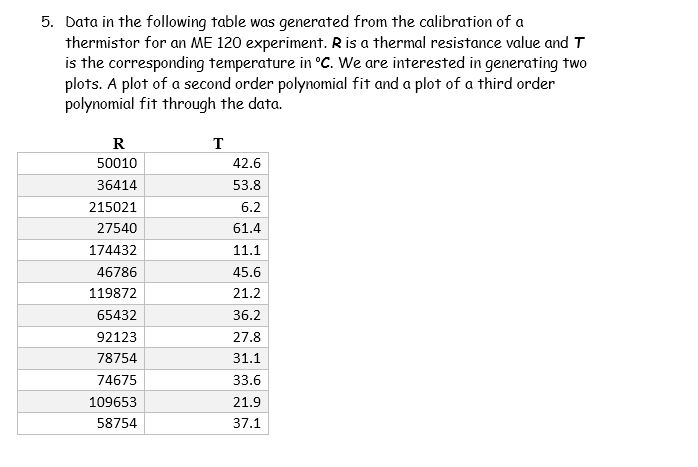
5. Data in the following table was generated from the calibration of a thermistor for an ME 120 experiment. R is a thermal resistance value and T is the corresponding temperature in C. We are interested in generating two plots. A plot of a second order polynomial fit and a plot of a third order polynomial fit through the data. 50010 36414 215021 27540 174432 46786 119872 65432 92123 78754 74675 109653 58754 42.6 53.8 6.2 61.4 11.1 45.6 21.2 36.2 27.8 31.1 33.6 21.9 37.1
Step by Step Solution
There are 3 Steps involved in it

Get step-by-step solutions from verified subject matter experts