

Question: Create this blood prussre chart using MATLAB given the systolic and diastolic values. Its done on an exel sheet, i posted it and its solution
Create this blood prussre chart using MATLAB given the systolic and diastolic values. Its done on an exel sheet, i posted it and its solution in exel but want it done in MATLAB 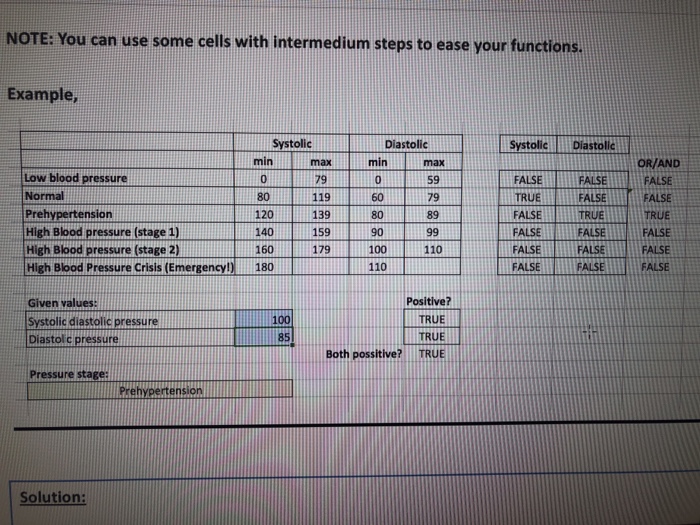
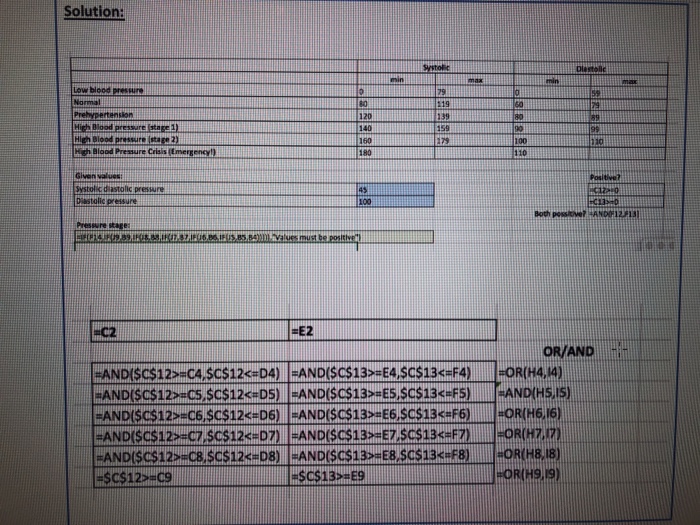
NOTE: You can use some cells with intermedium steps to ease your functions Example, Systolic Diastolic Systolic Diastolic min maxminmax OR/AND FALSE Low blood pressure 0 80 120 140 79 119 139 159 0 60 80 90 59 79 89 FALSE FALSE FALSE TRUE FALSE FALSE CE FALSE High Blood pressure (stage 1) High Blood pressure (stage 2) High Blood Pressure Crisis (Emergency!) 160179 10 110 REFALSE FALSE TRUE FALSE FALSE FALSE 1 L FALSE FALSE FALSE 180 Given values: Systolic diastolic pressure Diastolic pressure 100 85 Positive? TRUE TRUE Both possitive? TRUE Pressure stagei Prehypertension Solution
Step by Step Solution
There are 3 Steps involved in it
1 Expert Approved Answer
Step: 1 Unlock

Question Has Been Solved by an Expert!
Get step-by-step solutions from verified subject matter experts
Step: 2 Unlock
Step: 3 Unlock