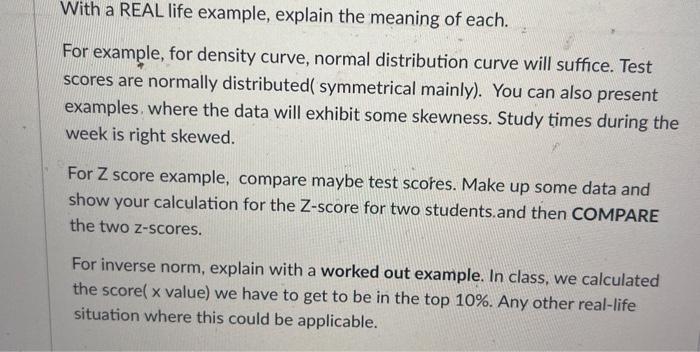
Question: create ur OWN examples to describe Density Curves, Z-scores and Inverse Norm. For more instructions read pic below With a REAL life example, explain the

create ur OWN examples to describe Density
create ur OWN examples to describe Density Curves, Z-scores and Inverse Norm. For more instructions read pic below With a REAL life example, explain the meaning of each. For example, for density curve, normal distribution curve will suffice. Test scores are normally distributed( symmetrical mainly). You can also present examples where the data will exhibit some skewness. Study times during the week is right skewed. For Z score example, compare maybe test scores. Make up some data and show your calculation for the Z-score for two students and then COMPARE the two Z-scores. For inverse norm, explain with a worked out example. In class, we calculated the scorel x value) we have to get to be in the top 10%. Any other real-life situation where this could be applicable

Step by Step Solution

There are 3 Steps involved in it

1 Expert Approved Answer
Step: 1 Unlock blur-text-image
Question Has Been Solved by an Expert!

Get step-by-step solutions from verified subject matter experts

Step: 2 Unlock
Step: 3 Unlock

Students Have Also Explored These Related General Management Questions!