

Question: Create Your Graphs First, use the data set below to create two graphs: 1. A pie chart for Race 2. A histogram for Age, with

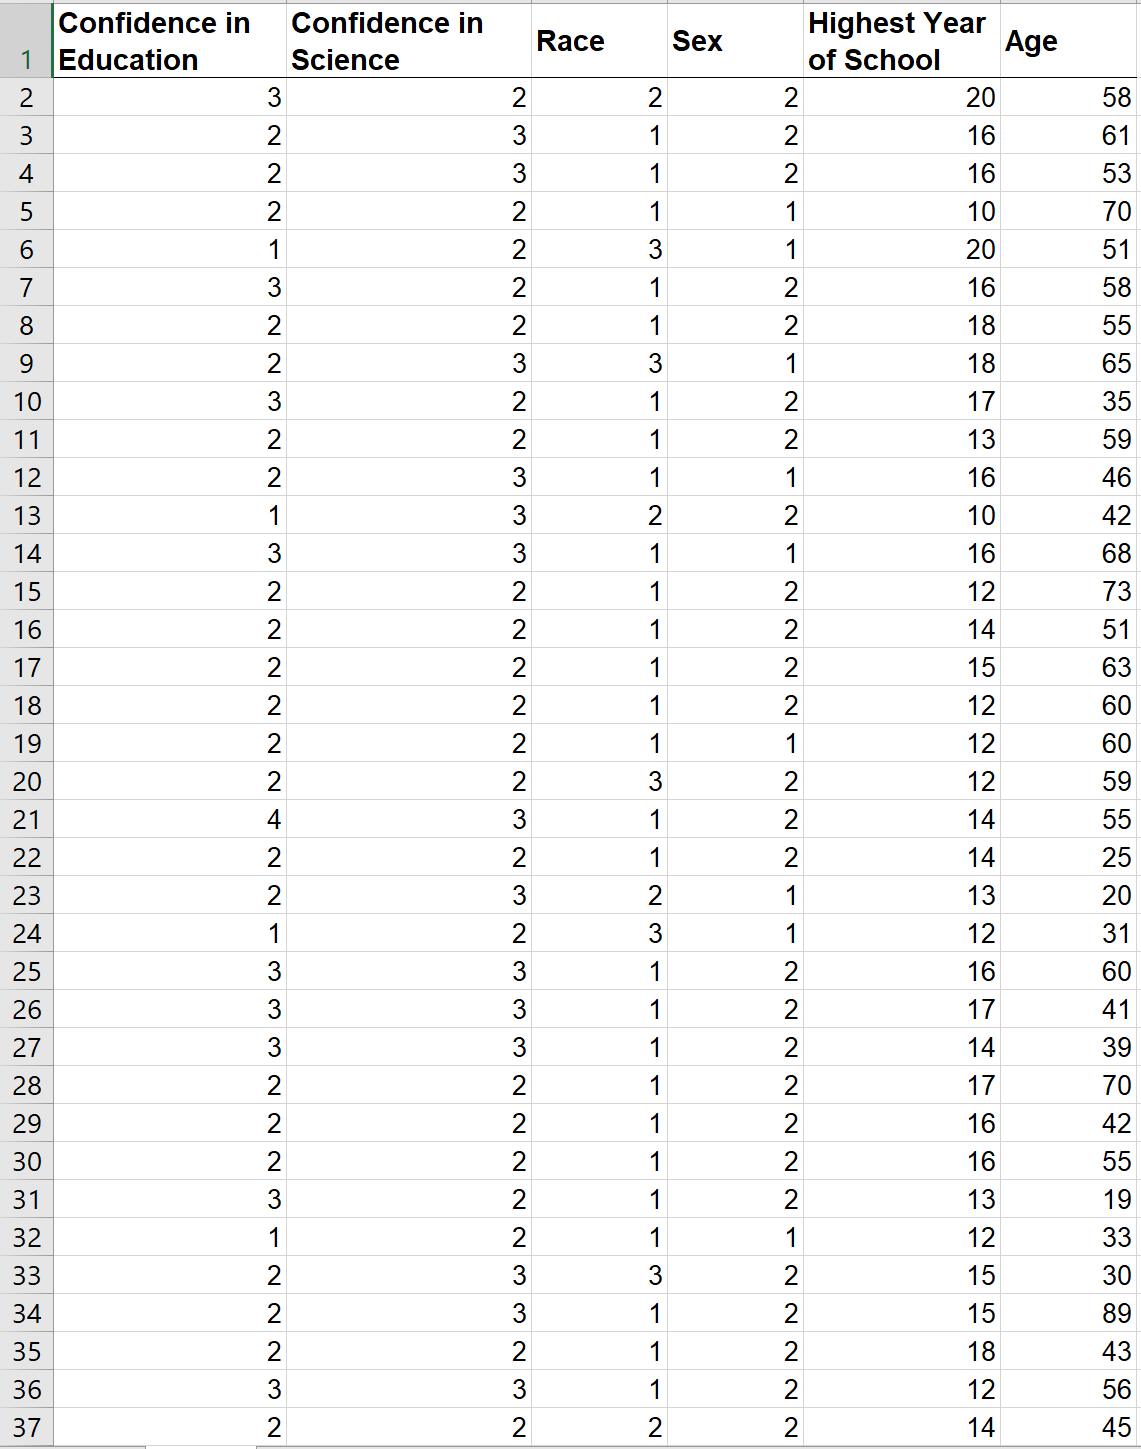
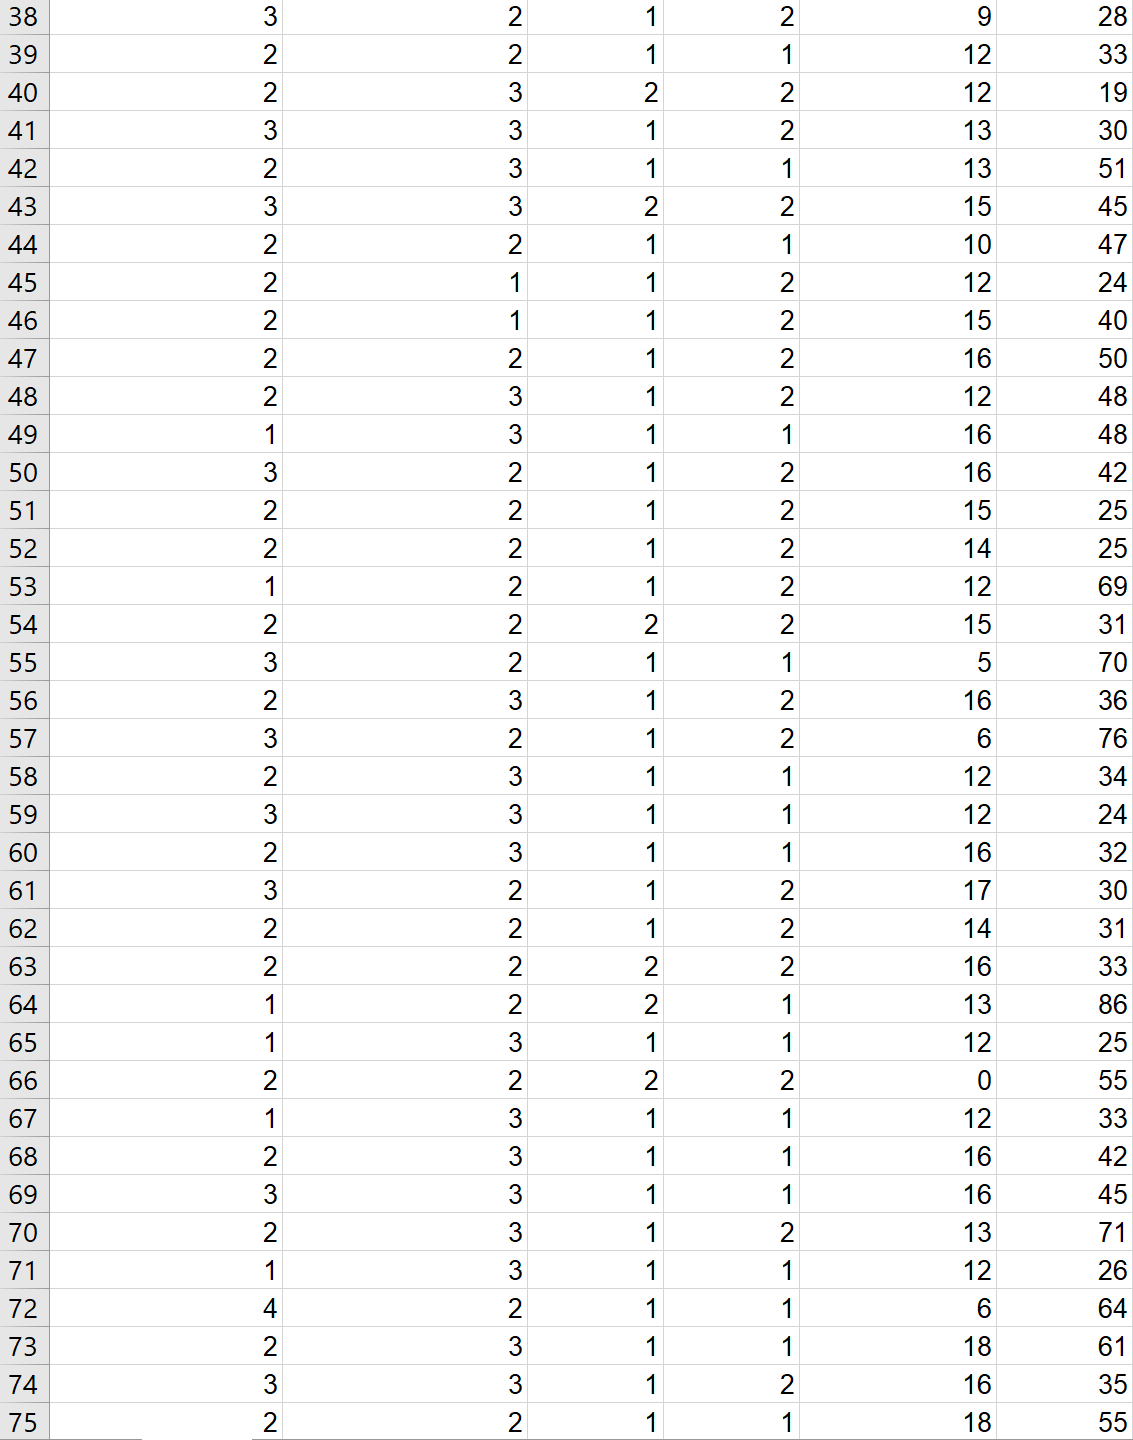
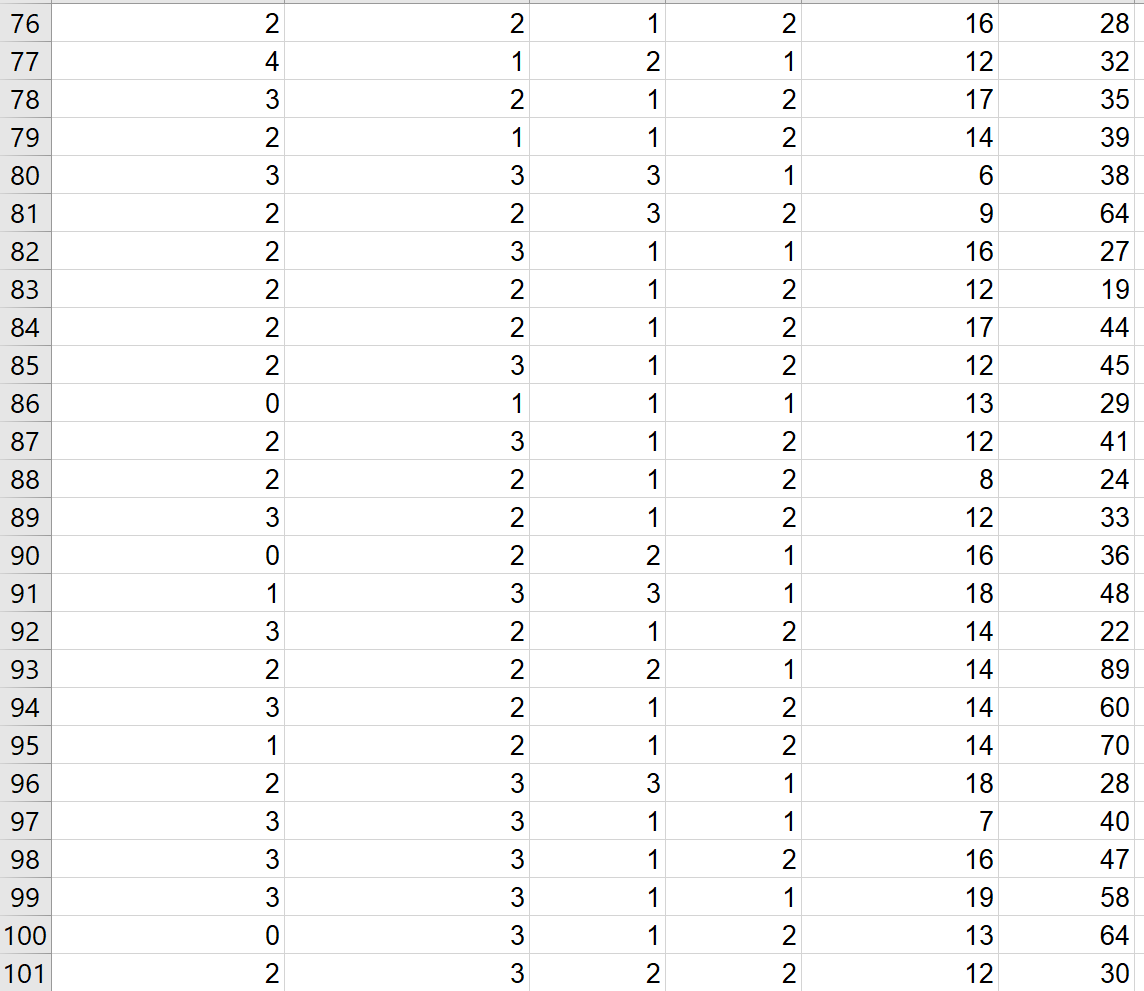
Create Your Graphs First, use the data set below to create two graphs: 1. A pie chart for Race 2. A histogram for Age, with a bin for each year based on the minimum and maximum data
Step by Step Solution
There are 3 Steps involved in it
1 Expert Approved Answer
Step: 1 Unlock

Question Has Been Solved by an Expert!
Get step-by-step solutions from verified subject matter experts
Step: 2 Unlock
Step: 3 Unlock