

Question: Create your own how-to guide on either calculating the stability envelope of a set of data or how to find the split middle line of
Create your own "how-to" guide on either calculating the stability envelope of a set of data or how to find the split middle line of progress to identify the trend of a data path. For this task, you can use the hypothetical set of data that you created for your Unit 4 discussion (using a maximum of 5-7 data points). You may choose any of the following formats to clearly present each of the necessary steps of your "how-to" guide:
(a) Create a PDF document of visual task analysis that demonstrates the step-by-step procedures using original screenshots and/or graphics.
Once you've completed the how-to guide, provide a brief narration or paragraph that accurately describes the stability/variability and trend of your data set.
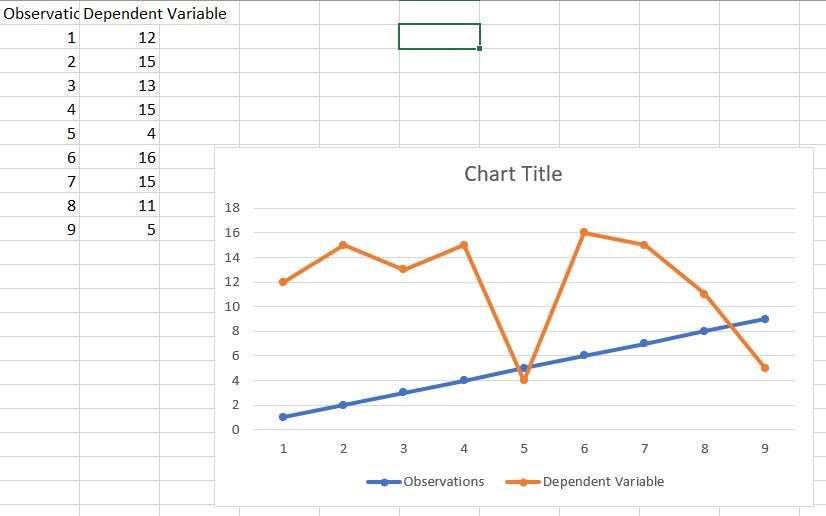
Data from Unit 4:
Step by Step Solution
There are 3 Steps involved in it

Get step-by-step solutions from verified subject matter experts