

Question: Creating a Graph in R using the Gather Function!! Create a faceted graph that visualizes the distributions of the total_cases and total_deaths columns. To do
Creating a Graph in R using the Gather Function!!
Create a faceted graph that visualizes the distributions of the total_cases and total_deaths columns. To do this, you will need to:
-
gather() these two columns, and pipe the output dataframe to ggplot() to plot the graph.
-
Facet the graph over the key column that you created with gather().
-
By default the x-axis of each facet will be on the same scale. However, the scale of these two variables is quite different, so me may wish to allow the x-axis range to vary between facets. We can do this with the scales = "free" argument in the faceting function, e.g.
facet_wrap(~..., scales = "free_x")
-
-
Pick a type of graph that is appropriate for visualizing the distribution of a single variable (we have learned about several such graphs - you may pick the one you prefer for this exercise). You will need to plot the value column created by the gather function in these graphs.
-
Remember to label your graph appropriately.
The final faceted figure should contain two sub-plots (one showing the distribution of total_cases, the other showing the distribution of total_deaths).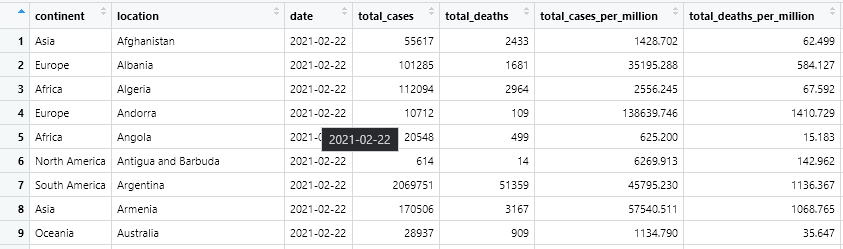
continent location date total_cases total_deaths total_cases_per_million total_deaths_per_million 1 Asia Afghanistan 2021-02-22 55617 2433 1428.702 62.499 2 Europe Albania 2021-02-22 101285 1681 35195.288 584.127 3 Africa Algeria 2021-02-22 112094 2964 2556.245 67.592 4 Europe Andorra 2021-02-22 10712 109 138639.746 1410.729 499 625.200 15.183 5 Africa Angola 6 North America Antigua and Barbuda 7 South America Argentina 2021-2021-02-22 20548 2021-02-22 614 14 6269.913 142.962 2021-02-22 2069751 51359 45795.230 1136.367 8 Asia Armenia 2021-02-22 170506 3167 57540.511 1068.765 9 Oceania Australia 2021-02-22 28937 909 1134.790 35.647 continent location date total_cases total_deaths total_cases_per_million total_deaths_per_million 1 Asia Afghanistan 2021-02-22 55617 2433 1428.702 62.499 2 Europe Albania 2021-02-22 101285 1681 35195.288 584.127 3 Africa Algeria 2021-02-22 112094 2964 2556.245 67.592 4 Europe Andorra 2021-02-22 10712 109 138639.746 1410.729 499 625.200 15.183 5 Africa Angola 6 North America Antigua and Barbuda 7 South America Argentina 2021-2021-02-22 20548 2021-02-22 614 14 6269.913 142.962 2021-02-22 2069751 51359 45795.230 1136.367 8 Asia Armenia 2021-02-22 170506 3167 57540.511 1068.765 9 Oceania Australia 2021-02-22 28937 909 1134.790 35.647
Step by Step Solution
There are 3 Steps involved in it

Get step-by-step solutions from verified subject matter experts