

Question: Creating a Simple Graphical User Interface (GUI) in MATLAB Use GUIDE in MATLAB to design a GUI program that plots the equation y(x) = ax^2
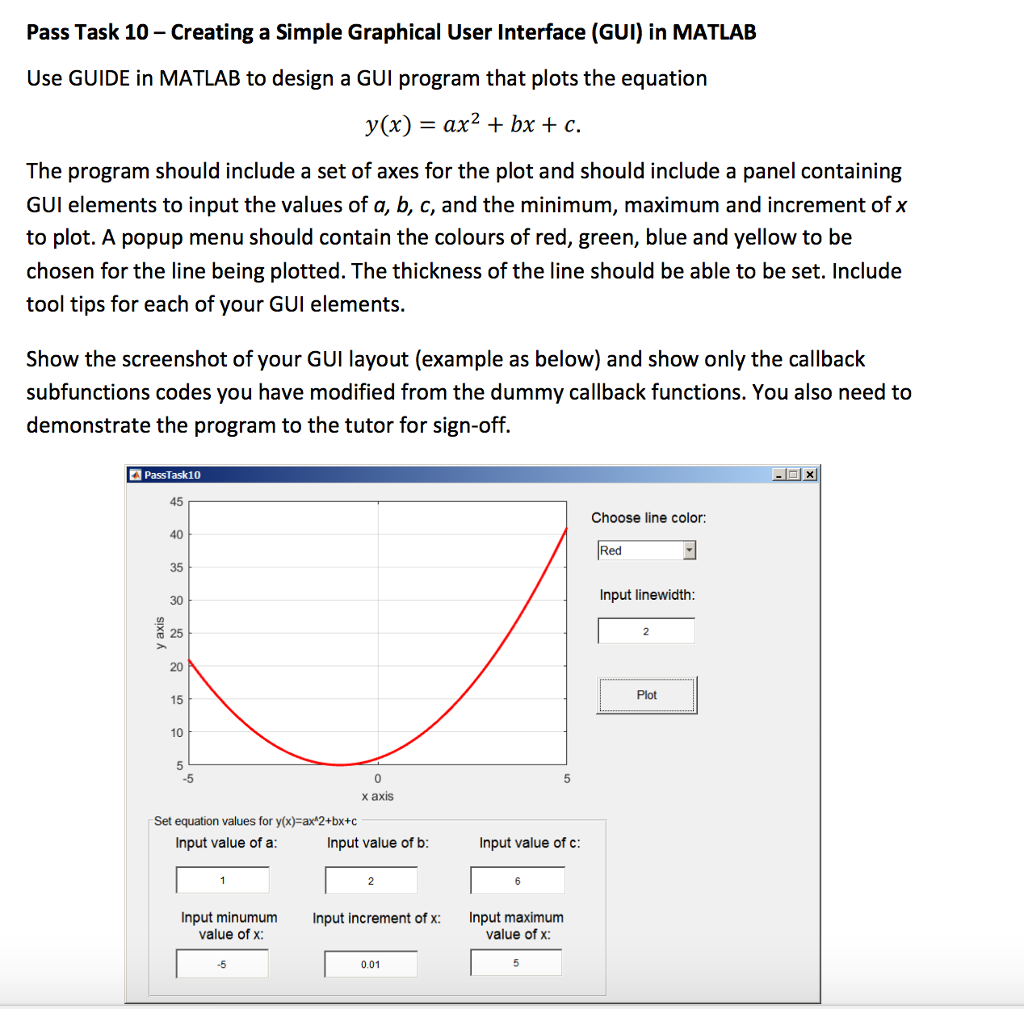
Creating a Simple Graphical User Interface (GUI) in MATLAB Use GUIDE in MATLAB to design a GUI program that plots the equation y(x) = ax^2 + bx + c. The program should include a set of axes for the plot and should include a panel containing GUI elements to input the values of a, b, c, and the minimum, maximum and increment of x to plot. A popup menu should contain the colours of red, green, blue and yellow to be chosen for the line being plotted. The thickness of the line should be able to be set. Include tool tips for each of your GUI elements. Show the screenshot of your GUI layout (example as below) and show only the callback subfunctions codes you have modified from the dummy callback functions. You also need to demonstrate the program to the tutor for sign-off
Step by Step Solution
There are 3 Steps involved in it

Get step-by-step solutions from verified subject matter experts