

Question: Creating Structured References, a Lookup Table, and a Treemap Problem: The City Market wants an easier way to keep track of the shelf life of
Creating Structured References, a Lookup Table, and a Treemap
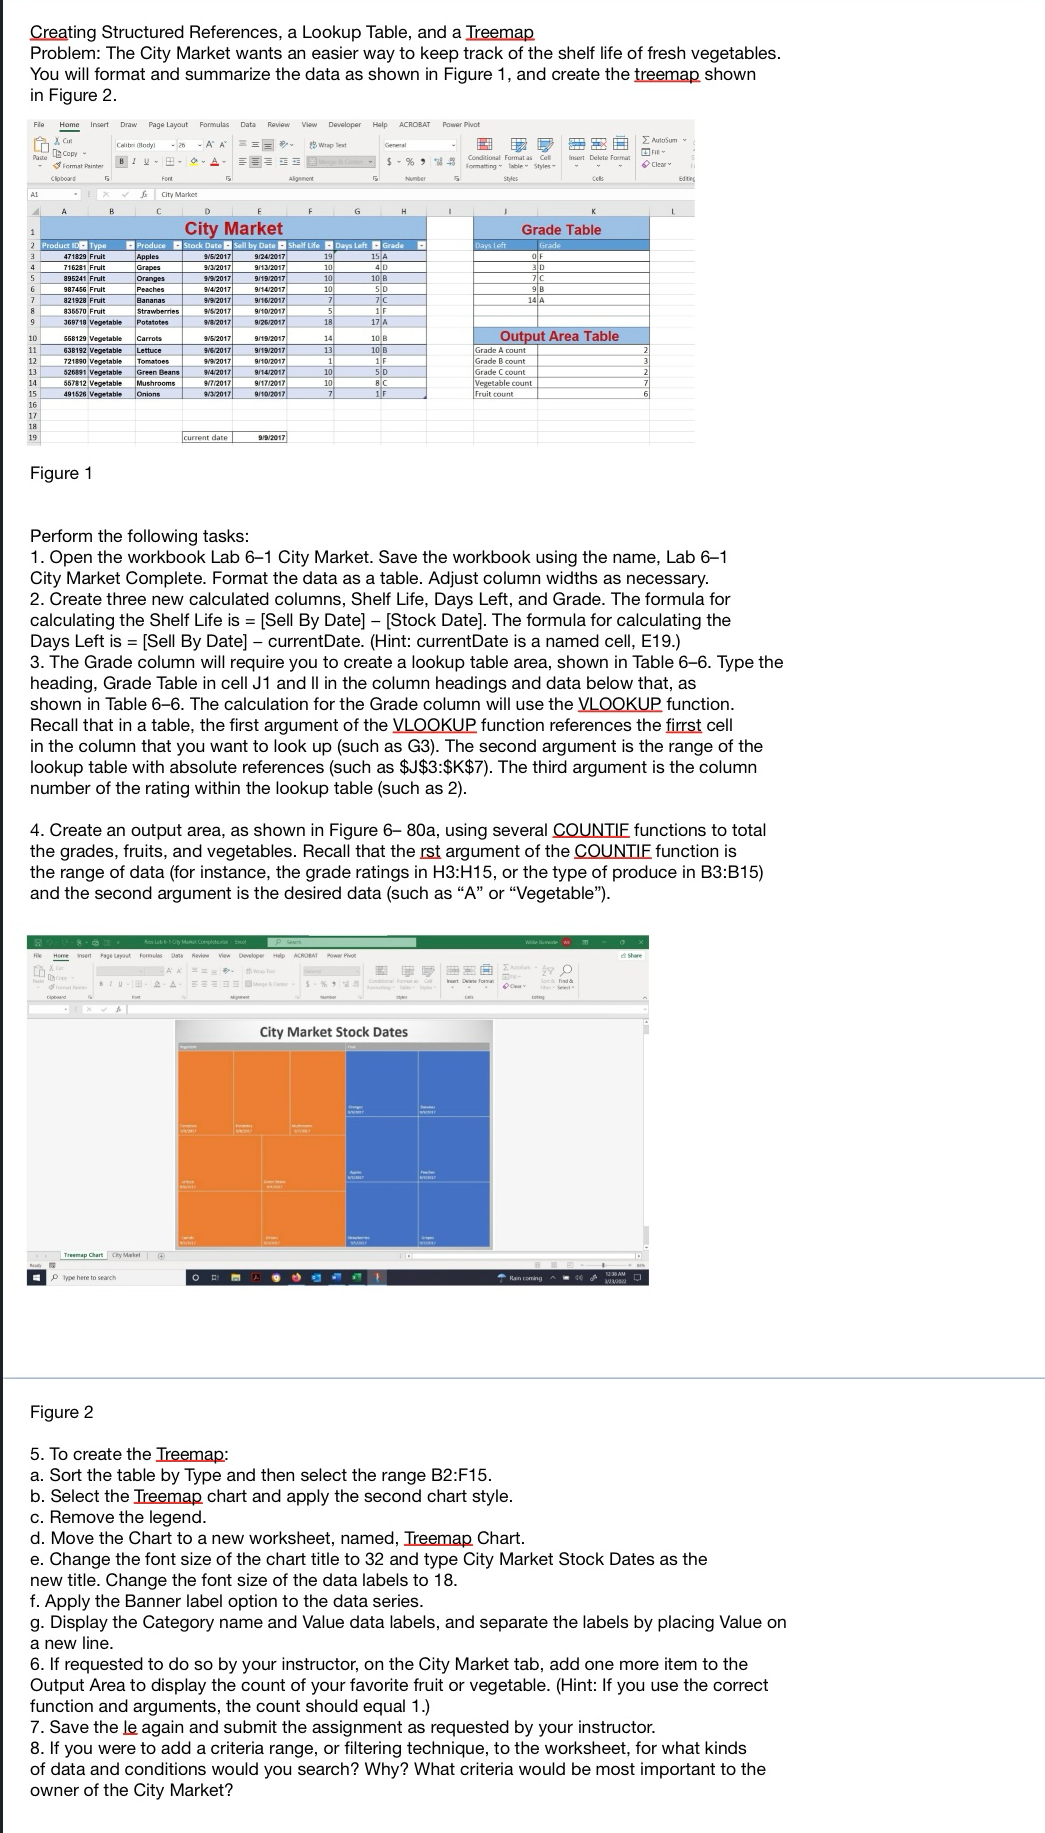
Problem: The City Market wants an easier way to keep track of the shelf life of fresh vegetables. You will format and summarize the data as shown in Figure and create the treemap shown in Figure
Figure
Perform the following task:
Open the workbook Lab City Market. Save the workbook using the name, Lab City Market Complete. Format the data as a table. Adjust column widths as necessary. Create three new calculated columns, Shelf Life, Days Left, and Grade. The formula for calculating the Shelf Life is Sell By DateStock Date The formula for calculating the Days Left is Sell By Date currentDate. Hint: currentDate is a named cell, E The Grade column will require you to create a lookup table area, shown in Table Type the heading, Grade Table in cell J and II in the column headings and data below that, as shown in Table The calculation for the Grade column will use the VLOOKUP function. Recall that in a table, the first argument of the VLOOKUP function references the firrst cell in the column that you want to look up such as G The second argument is the range of the lookup table with absolute references such as $$:$$ The third argument is the column number of the rating within the lookup table such as
Create an output area, as shown in Figure a using several COUNTIE functions to total the grades, fruits, and vegetables. Recall that the rst argument of the COUNTIE function is the range of data for instance, the grade ratings in : or the type of produce in : and the second argument is the desired data such as A or "Vegetable"
Figure
To create the Ireemap:
a Sort the table by Type and then select the range B:F
b Select the Treemap chart and apply the second chart style.
c Remove the legend.
d Move the Chart to a new worksheet, named, Ireemap Chart.
e Change the font size of the chart title to and type City Market Stock Dates as the new title. Change the font size of the data labels to
f Apply the Banner label option to the data series.
g Display the Category name and Value data labels, and separate the labels by placing Value on a new line.
If requested to do so by your instructor, on the City Market tab, add one more item to the Output Area to display the count of your favorite fruit or vegetable. Hint: If you use the correct function and arguments, the count should equal
Save the le again and submit the assignment as requested by your instructor.
If you were to add a criteria range, or filtering technique, to the worksheet, for what kinds of data and conditions would you search? Why? What criteria would be most important to the owner of the City Market?
Step by Step Solution
There are 3 Steps involved in it
1 Expert Approved Answer
Step: 1 Unlock

Question Has Been Solved by an Expert!
Get step-by-step solutions from verified subject matter experts
Step: 2 Unlock
Step: 3 Unlock