

Question: critical path. Table 2 shows the three time estimates and expected time Activity A B H I J L M Predecessors E D E,G
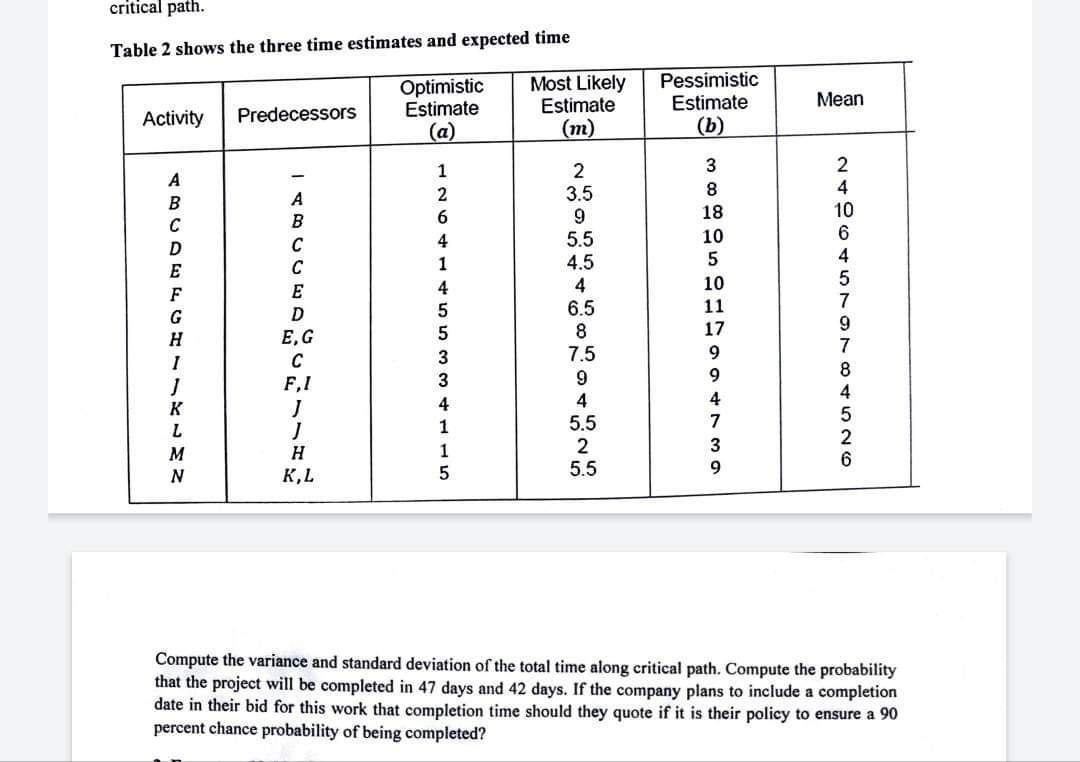
critical path. Table 2 shows the three time estimates and expected time Activity A B H I J L M Predecessors E D E,G C F,I J J H K,L Optimistic Estimate (a) 1 2 6 4 1 4 5 5 3 3 4 1 1 5 Most Likely Estimate (m) 2 3.5 9 5.5 4.5 4 6.5 8 7.5 9 4 5.5 2 5.5 Pessimistic Estimate (b) 3 MSGHDOOTma 242645TGBTE26 8 18 10 5 10 11 17 9 9 4 7 3 Mean 9 10 7 8 Compute the variance and standard deviation of the total time along critical path. Compute the probability that the project will be completed in 47 days and 42 days. If the company plans to include a completion date in their bid for this work that completion time should they quote if it is their policy to ensure a 90 percent chance probability of being completed?
Step by Step Solution
3.41 Rating (154 Votes )
There are 3 Steps involved in it
Variance The variance of the total time along the critical path is the average squared deviation of the time estimates for each activity from the mean of the time estimates To calculate the variance w... View full answer

Get step-by-step solutions from verified subject matter experts