Question: Critical Thinking Exercise on Strategic Groups II. Constructing a Strategic Group Map The purpose of constructing a Strategic Group Map is to not only illustrate
Critical Thinking Exercise on Strategic Groups
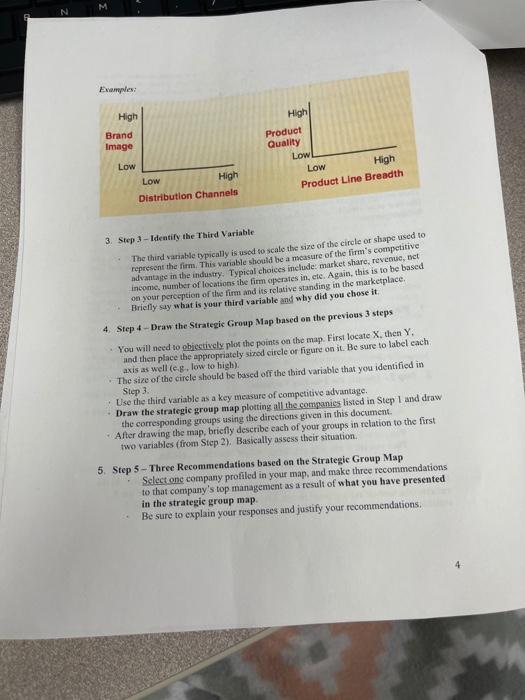

II. Constructing a Strategic Group Map The purpose of constructing a Strategic Group Map is to not only illustrate how rivals within an industry compete, but it should also reveal which rivals stand out and why. Your map should clearly reveal the competitive positions of the firms that compete as rivals in a given segment of the industry. For the purpose of this exercise, you are being asked to create a Strategic Group Map for the automobile Industry, solely based on your knowledge of the car market as a consumer and as a business student. You will be asked to explain and justify your creation of this strategie group map and then be asked to use it to make recommendations There are five steps to this exercise. You are to read the following explanations of the first four steps listed below, and then place your responses to all of the steps on the following pages On the final page (Step 5). you will be asked to develop and then discuss three specific strategic recommendations you would make as a consultant to top executives of one of the firms in the auto industry represented on your map 1. Step 1 - Identify Competitors in the Industry This should be a list of at least ten competitors in the auto industry (by brand, not automaker). For example, say Buick or Chevrolet and not General Motors the parent corporation 2. Step 2 - Identify the Two Rey Variables These should not be strongly correlated with each other. Both competitive factors should be expressed in a low to high range that are measurable variables.leg.price, product quality, brand image, distribution channels) You are to briefly explain what you mean by each of these two variables. Then you are to say why you chose cach of these two variables. In these two examples on the next page, the X and Y variables are clearly visible. In the first example, the X variable (the horizontal axis) is distribution channels, and the Y variable (the vertical axis) is brand image. Likewise, in the second graphic, the X variable is product line breadth, and the Y variable is product quality. 3 M Examples High Brand Image High Product Quality Low Low High Product Line Breadth Low Low High Distribution Channels 3. Step 3 - Identify the Third Variable The third variable typically is used to scalo the size of the circle or shape used to represent the firm. This variable should be a measure of the firm's competitive advantage in the industry. Typical choices include market share, revenue, net income, number of locations the firm operates in, etc. Again, this is to be based on your perception of the firm and its relative standing in the marketplace Briefly say what is your third variable and why did you chose it 4. Step 4 - Draw the Strategic Group Map based on the previous 3 steps You will need to objectively plot the points on the map. First locate X, then Y and then place the appropriately sirod circle or figure on it. Be sure to label cach axis as well (eg, low to high) The size of the circle should be based off the third variable that you identified in Step 3. Use the third variable as a key measure of competitive advantage Draw the strategic group map plotting all the companies listed in Step I and draw the corresponding groups using the directions given in this document After drawing the map, briefly describe each of your groups in relation to the first two variables (from Step 2). Basically assess their situation 5. Step 5 - Three Recommendations based on the Strategic Group Map Select one company profiled in your map, and make three recommendations to that company's top management as a result of what you have presented in the strategie group map Be sure to explain your responses and justify your recommendations. Section II. - Critical Thinking Exercise on Strategle Groups for Management Majors ANSWER SHEETS Student Names Dates OMIS 430 Step 1 - Identify at Least Ten Competitors in the industry 1 2. 3. 4 5 7. 8 9. 10 (continue list if you can name more) 5 Step 2 - Identify the Two Key Variables Variable (explain what this means and why it was selected): Variable 2 (explain what this means and why it was selected): Step 3 - Identify the Third Variable (what it is and why you chose it). 6 Step 4 - Draw the Strategie Group Map based on the previous steps Draw the strategic group map plotting all the companies listed in Step and draw the corresponding groups using the direction given in this document. Step 4 (continued) After drawing the strategie roup map, describe each of the strategic groups that you have created based on the two variables you selected in Step 2 8 Step 5 - Three Recommendations based on the strategie Group Map Based on this analysis, if I were a consultant to company), my strategie recommendations to their top management (along with justification for each, based on the results of the trafegie group mapping exercise) worted be: insert chosen car 1 3. 9


