

Question: croeconomics Exam 2 Problem Section (1) - Word Search Layout References Mailings Review View Help Po AaBbCcI AaBbCel AaBbCc AaBboct AaB A 1 Normal 1
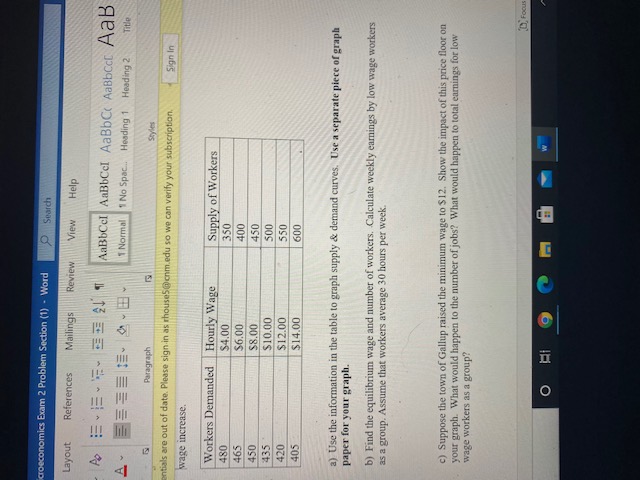
croeconomics Exam 2 Problem Section (1) - Word Search Layout References Mailings Review View Help Po AaBbCcI AaBbCel AaBbCc AaBboct AaB A 1 Normal 1 No Spac. Heading 1 Heading 2 Title Paragraph ontials are out of date. Please sign in as rhouse5monm edu so we can verify your subscription. Sign In wage increase. Workers Demanded Hourly Wage Supply of Workers 480 $4.00 350 465 $6.00 400 450 $8.00 450 435 $10.00 500 420 $12.00 550 405 $14.00 600 a) Use the information in the table to graph supply & demand curves. Use a separate piece of graph paper for your graph. b) Find the equilibrium wage and number of workers. Calculate weekly earnings by low wage workers as a group. Assume that workers average 30 hours per week. c) Suppose the town of Gallup raised the minimum wage to $12. Show the impact of this price floor on your graph. What would happen to the number of jobs? What would happen to total earnings for low wage workers as a group? Focus O 9 M W
Step by Step Solution
There are 3 Steps involved in it

Get step-by-step solutions from verified subject matter experts