

Question: Cross-Tab (Multi-dimensional) Analysis using Excels Pivot Table/Chart: You are given a data set and this word document that describes your required tasks for Individual Assignment
Cross-Tab (Multi-dimensional) Analysis using Excels Pivot Table/Chart: You are given a data set and this word document that describes your required tasks for Individual Assignment 1. This individual homework mirrors the skill requirements for your group project. It is expected to help you in the process in the areas of descriptive statistics, data exploration and visualization and documentation of key insights. There is no one perfect answer. We evaluate your process and approach to deliver insights, along with the scope of analysis you conduct to deliver those insights. Required submission: a. For each student, 1 Excel file with named worksheets and 1 Word document for reporting key insights; b. Rename your file: FirstInitialLastNameLastTwoDigitsOfStudNo. (E.g. SYUAN11); c. Verify your submission before the deadline. Please review the penalty for late submission in the course syllabus. You are NOT allowed to share files with others. HF Commercial Equipment Finance currently has about 4000 customers. These customers obtained loans to purchase various types of equipment. Some customers also have structured lease solutions for the use of various equipments. These solutions can be traditional lease or quasi-lease, which has different tax implications. Unlike in the environment of consumer-oriented businesses, customers in the B2B environment have been very slow in embracing electronic payments. To gain operational efficiencies and achieve cost reduction, HF has introduced an electronic payment systems (EPS) option to collect monthly payments from their customers. However, adoption to-date of the EPS option has been insufficient. HF wants to use data mining techniques to better understand the differences in EPS adoption rates across the much diversified customer base. It also wants to use the analysis to design promotion to help in the conversion of non-EPS users into adopters of the EPS technology. However, before HF employs any advanced data mining techniques, it needs the help of your team to generate important descriptors and summarizations as well as cross tabulations of the data. In particular, your team will help HF in conducting extensive multi-dimensional analysis of EPS adoption using Pivot tables and Pivot charts in Microsoft Excel. The dataset you will use is in the file HFEPS.xls. It contains data about each of the customers. The following attributes have information about the characteristics of each firm identified by a customer number: Total Employees, Paydex (a measure of the companys risk; higher value is better like a credit score), Geographical Region it is located in, and the Industry Type it belongs to. Additionally, the attributes: Number of Schedules and Product Type describe the relationship each company has with HF. Number of Schedules is the total number of leases and loans the company currently has with HF and the Product Type refers to the type of financing. As the name indicates, Average Previous Payment is the average amount of payment the customer made in the past. EPS Adoption is a binary (yeso) variable indicating whether the company has adopted HFs EPS option. See the figure below. Deliverables: HF asks you to develop an Excel workbook that includes several worksheets. In each worksheet, you will examine the adoption rate of EPS by a different set of dimensions (attributes) in the data using pivot tables and charts. HF is particularly interested in the multidimensional view of EPS adoption for promotional efforts in the future. For example, in addition to knowing the current adoption rates (i.e., percentages) of EPS by Industry Type, HF would like to see the information cross-tabulated by Industry Type or Region or any other categorical variable or continuous variable after discretization. Name/rename your pivot tables and pivot charts to reflect the attributes analyzed in each worksheet. HF asks you to explore all the variables in the data if they have any implication on EPS adoption rates. Therefore, for the numerical variables, HF asks you to discretize the variables and create fewer categories to facilitate the pivot analyses. Your decision on the attribute value ranges (i.e., lower and upper limits) to discretize these variables could be based on your examination of the value distribution in the data or any reference to industry practice. In any case, you should document the rationale used. Following your analyses, HF asks you to prepare a short report (Maximum 3 pages; double spaced in 12 point) that could potentially provide preliminary insights into the data for HFs future analysis. To this end, you should highlight the key insights obtained from your pivot EPS Adoption Paydex (risk) Number of Employees (size) Region Industry Type Number of Schedules Product Type Average Previous Payment 4 tables and charts. Identify and describe key indications from your cross-tabulations that could help in the conversion of non-EPS users into adopters of the EPS technology. Where do you think HF needs to focus on to increase adoption (i.e., in terms of Industry Type, Region, Company Size, Product Type, or any combination, etc.)?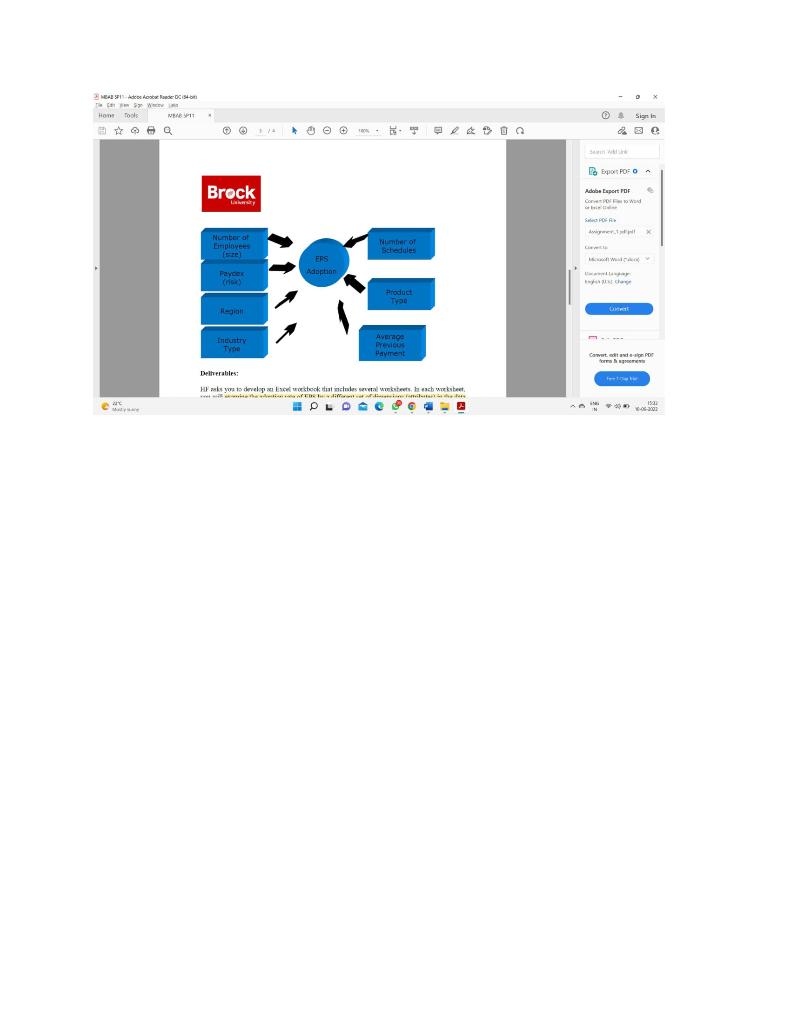
Step by Step Solution
There are 3 Steps involved in it

Get step-by-step solutions from verified subject matter experts