

Question: Crossword Puzzle 1 Across 3. This graph is an example of a 4 Frequency N 10 20 30 40 50 60 70 7. The to
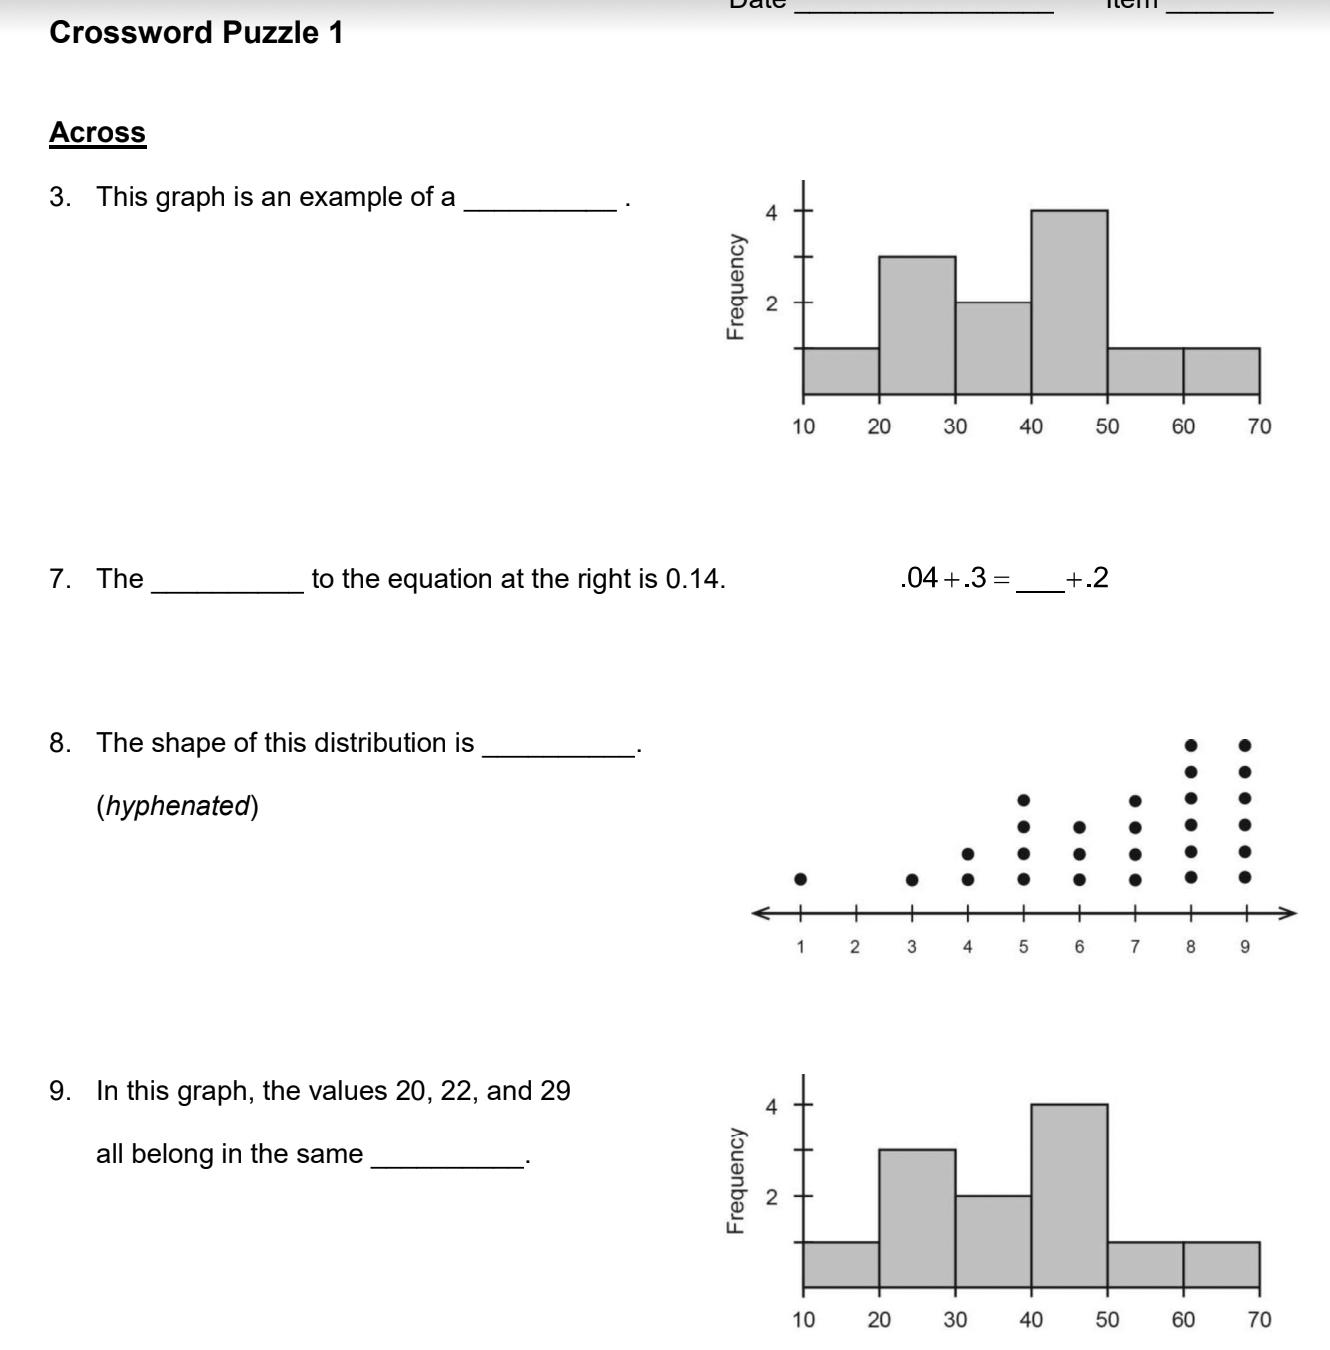
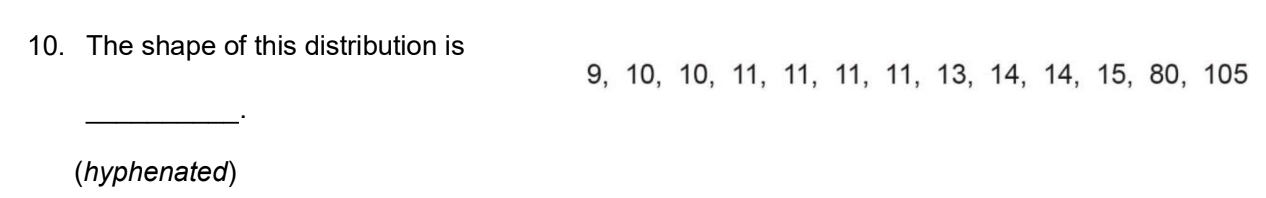
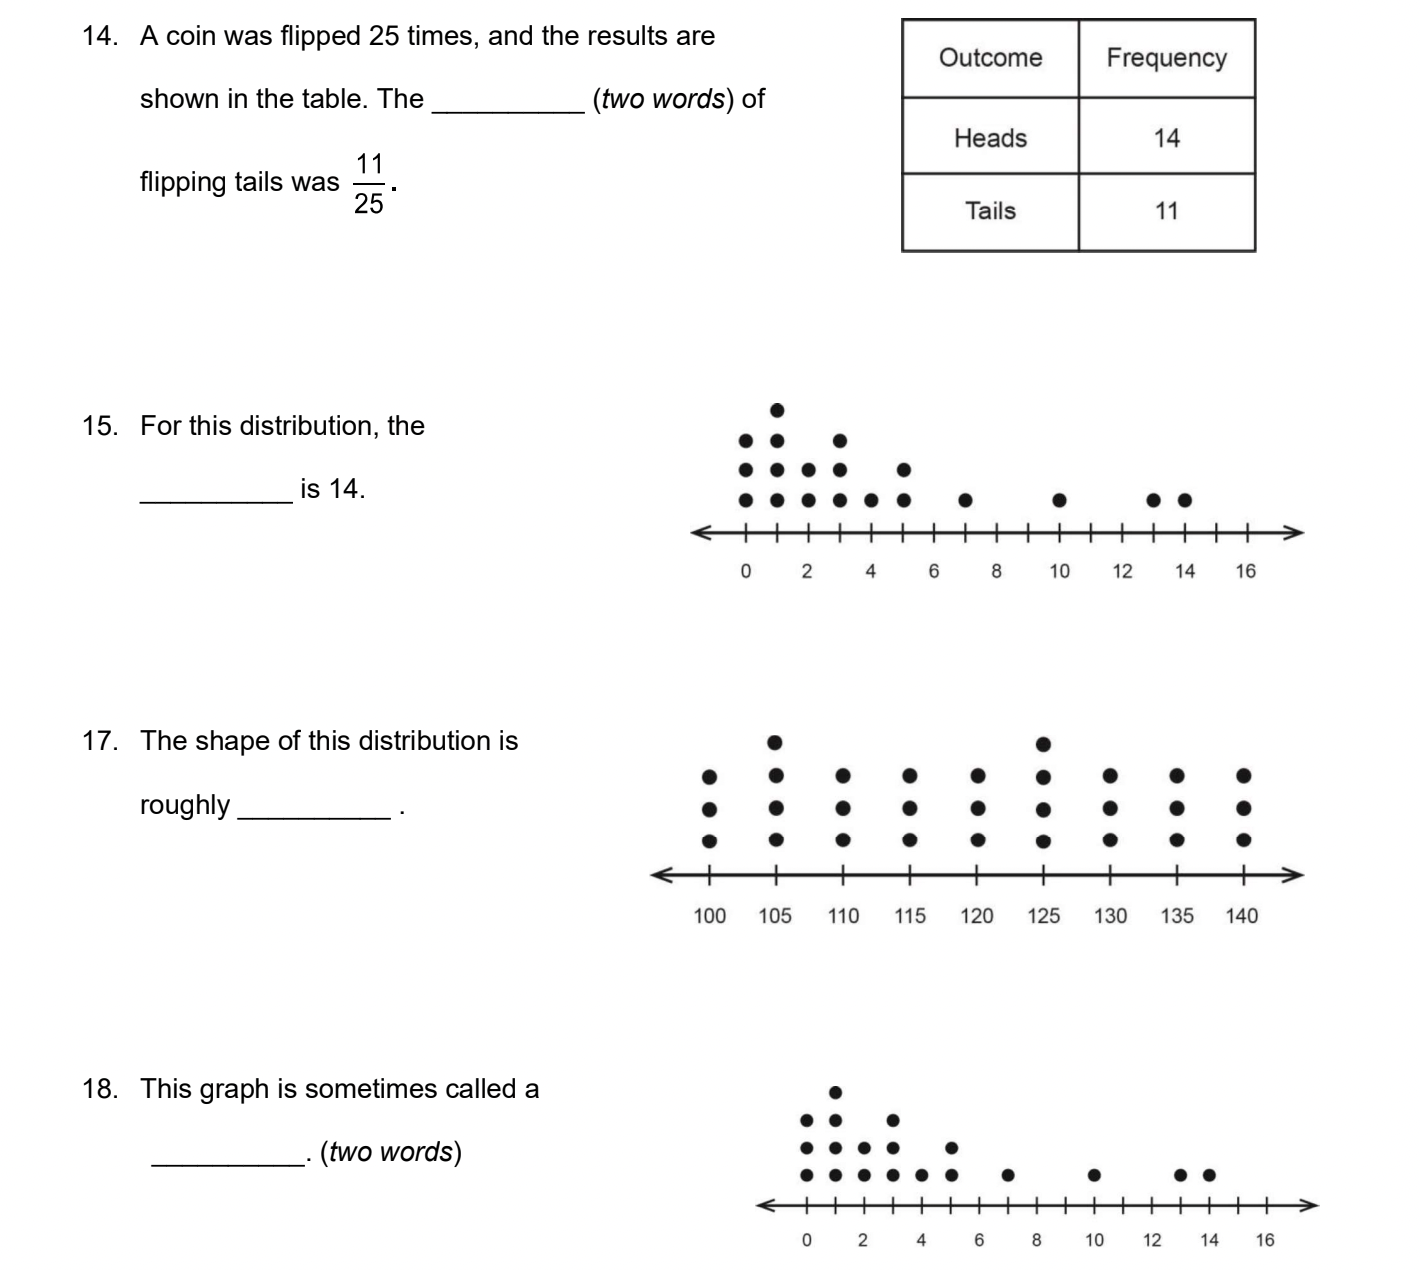
Crossword Puzzle 1 Across 3. This graph is an example of a 4 Frequency N 10 20 30 40 50 60 70 7. The to the equation at the right is 0.14. 04+.3 = +.2 8. The shape of this distribution is (hyphenated) . 2 9. In this graph, the values 20, 22, and 29 4 + all belong in the same Frequency N 10 20 30 40 50 60 70\f14. A coin was flipped 25 times, and the results are shown in the table. The 11 i in tails was . DP 9 25 15. For this distribution, the is 14. 17. The shape of this distribution is roughly 18. This graph is sometimes called a . (two words) (two words) of
Step by Step Solution
There are 3 Steps involved in it
1 Expert Approved Answer
Step: 1 Unlock

Question Has Been Solved by an Expert!
Get step-by-step solutions from verified subject matter experts
Step: 2 Unlock
Step: 3 Unlock