

Question: Cumulative Probabilities for the Standard Normal Distribution Cumulasve probability Table entries represent the shaded area in the figure FIRST DIGIT OF 2 FIRST DIGIT OF
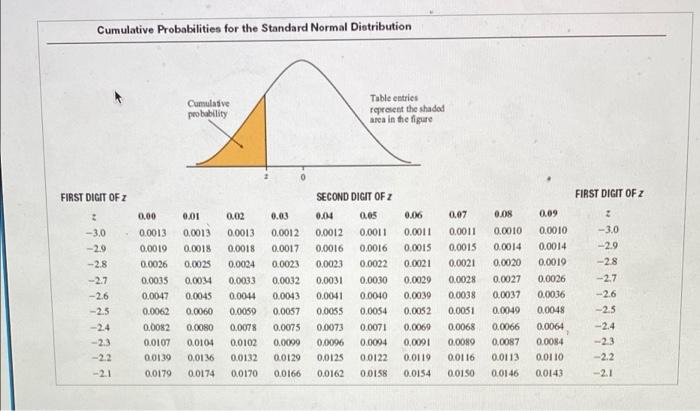
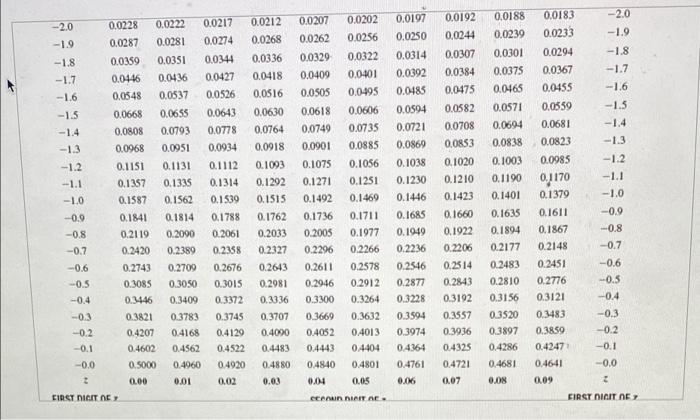
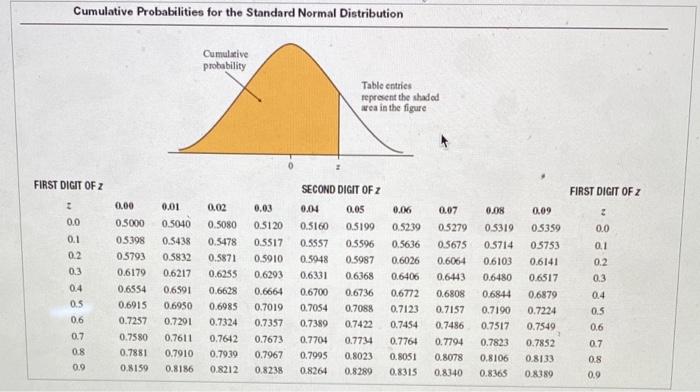
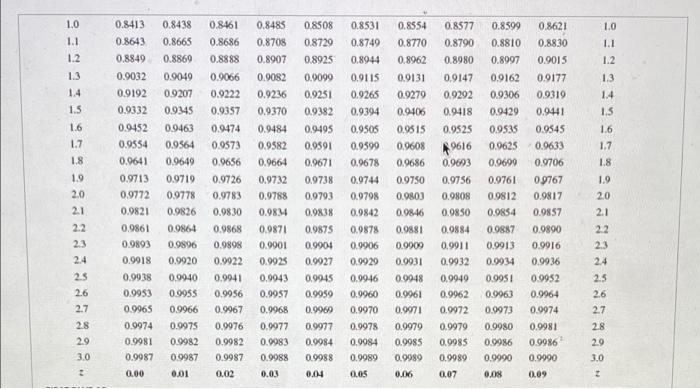
Cumulative Probabilities for the Standard Normal Distribution Cumulasve probability Table entries represent the shaded area in the figure FIRST DIGIT OF 2 FIRST DIGIT OF Z 0.09 2 0.02 0.0013 0.0018 0.0024 2 -3.0 -29 -2.8 -2.7 -2.6 -2.5 -2.4 0.00 0.0013 0.0019 0.0026 0.0035 0.0047 0.0062 0.0082 0.0107 00139 0.0179 0.01 0.0013 0.0018 0.0025 0.0034 0.0045 0.0060 0.0080 0.0104 0.0136 0.0174 0.03 0.0012 0.0017 0.0023 0.0032 0.0043 0.0057 0.0075 0.0099 0.0129 0.0166 0.0033 0.0014 0.0059 SECOND DIGIT OF 2 0.04 0.05 0.0012 0.0011 0.0016 0.0016 0.0023 0.0022 0.0031 0.0030 0.0041 0.0010 0.0055 0.0054 0.0073 0.0071 0.0094 0.0125 0.0122 0.0162 0.0158 0.06 0.0011 0.0015 0.0021 0.0029 0.0039 0.0052 0.0069 0.0001 0.0119 0.0154 0.07 0.0011 0.0015 0.0021 0.0028 0.0038 0.0051 0.0068 0.0089 0.0116 0.0150 0.08 0.0010 0.0014 0.0020 0.0027 0.0037 0.0049 0.0066 0.0087 0.0113 0.0146 2 -3.0 -2.9 -28 -2.7 -2.6 -2.5 0.0010 0.0014 0.0019 0.0026 0.0036 0.0048 0.0064 0.0084 0.0110 0.0143 -2.4 96000 0.0078 0.0102 0.0132 0.0170 -22 -23 -22 -2.1 0.0197 0.0250 0.0314 0.0392 0.0185 0.0192 0,0244 0.0307 0.0384 0.0475 0.0582 0.0708 0.0833 -2.0 -1.9 -1.8 -1.7 -1.6 -1.5 -2.0 0.0228 0.0222 0.0217 -1.9 0.0287 0.0281 0.0274 -1.8 0.0359 0.0351 0.0344 -1.7 0.0446 0.0436 0.0427 -1.6 0.0548 0.0537 0.0526 -1.5 0.0668 0.0655 0.0643 -1.4 0.0808 0.0793 0.0778 -13 0.0968 0.0951 0.0934 -1.2 0.1151 0.1131 0.1112 -1.1 0.1357 0.1335 0.1314 -1.0 0.1587 0.1562 0.1539 -0.9 0.1841 0.1814 0.1788 -0.8 0.2119 0.2090 0.2061 -0.7 0.2420 0.2389 0.2358 -0.6 0.2743 0.2709 0.2676 -0.5 0.3085 0.3050 0.3015 -0.4 0.3446 0.3409 0.3372 -0.3 0.3821 0.3783 0.3745 -0.2 0.4207 0.4168 0.4129 -0.1 0.4602 0.4562 0.4522 -0.0 0.5000 0.4960 0.4920 0.00 0.01 0.02 FIRST DICIT DE 0.0212 0.0268 0.0336 0.0418 0.0516 0.0630 0.0764 0.0918 0.1093 0.1292 0.1515 0.1762 0.2033 0.2327 0.2643 0.2981 0.3336 0.3707 0.4090 0.4483 0.4880 0.03 0.0207 0.0262 0.0329 0.0409 0.0505 0.0618 0.0749 0.0901 0.1075 0.1271 0.1492 0.1736 0.2005 0.2296 0.2611 0.2946 0.3300 0.0202 0.0256 0.0322 0.0-401 0.0495 0.0606 0.0735 0.0885 0.1056 0.1251 0.1469 0.1711 0.1977 0.2266 0.2578 0.2912 0.3264 0.3632 0.4013 04404 0.4801 0.05 0.1020 0.1210 0.1423 0.0594 0.0721 0.0869 0.1038 0.1230 0.1446 0.1685 0.1949 0.2236 0.2546 0.2877 0.3228 0.3594 0.3974 0.4364 0.0188 0.0183 0.0239 0.0233 0.0301 0.0294 0.0375 0.0367 0.0465 0.0455 0.0571 0.0559 0.0694 0.0681 0.0838 0.0823 0.1003 0.0985 0.1190 0.1170 0.1401 0.1379 0.1635 0.1611 0.1894 0.1867 0.2177 0.2148 0.2483 0.2451 0.2810 0.2776 0.3156 0.3121 0.3520 0.3483 0.3897 0.3850 0.4286 0.4247 0.4681 0.4641 0.08 0.09 0.1660 0.1922 0.2206 0.2514 0.2843 0.3192 0.3557 0.3936 0.4325 0.4721 0.07 -1.3 -1.2 -1.1 -1.0 -0.9 -0.8 -0.7 -0.6 -0.5 -0.4 -0.3 -0.2 -0.1 -0.0 2 0.3669 0.4052 0.4443 0.4840 0.04 0.4761 0.06 CRAN RIIT NE. FIRST DICIT DE Cumulative Probabilities for the Standard Normal Distribution Cumulative probability Table entries represent the shaded wrea in the figure FIRST DIGIT OF Z SECOND DIGIT OF Z FIRST DIGIT OF 2 3 0.00 0.01 0.04 0.05 0.0 0.5040 0.0% 0.5239 0.0 0.1 0.2 0.3 0.5000 05398 05793 0.6179 0.6554 0.6915 0.7237 0.7580 0.7881 0.8159 0.4 0.5 0.02 0.5080 0.5478 0.5871 0.6255 0,6628 0.6985 0.7324 0.7642 0.79.39 0.8212 0.5438 0.5832 0.6217 0,6591 0.6950 0.7291 0.7611 0.7910 0.8186 0.03 0.5120 0.5517 0.5910 0.6293 0.6664 0.7019 0.7357 0.7673 0.7967 0.8238 0.3160 0.5557 0.5948 0.6331 0.6700 0.7054 0.7389 0.7704 0.7995 0.8264 0.5199 0.5596 0.5987 0.6368 0.6736 0.7088 0.7422 0.7734 0.8023 0.8289 0.1 0.2 0.3 0.4 0.07 0.5279 0.5675 0.6064 0.6443 0.6808 0.7157 0.7486 0.7794 0.8078 0.8340 0.5636 0.6026 0.6406 0.6772 0.7123 0.7454 0.776 0.8051 0.8315 0.08 0.5319 0.5714 0.6103 0.6480 0.6844 0.7190 0.7517 0.7823 0.8106 0.8365 0.09 0.5359 0.5753 0.6141 0.6517 0.6879 0.7224 0.7549 0.7852 0.8133 0.8389 0.5 0.6 0.7 0.8 0.9 0.6 0.7 0.8 0.9 0.8485 1.0 1.1 1.2 0.8708 0.8907 0.8508 0.8729 0.8925 1.0 1.1 1.2 1.3 1.4 15 1.6 1.7 1.8 1.9 2.0 2.1 0.8413 0.8643 0.8849 0.9032 0.9192 0.9332 0.9452 0.9554 0.9641 0.9713 0.9772 0.9821 0.9861 0.9893 0.9918 0.9938 0.9953 0.9965 0.9974 0.9981 0.9987 0.00 0.8438 0.8665 0.8860 0.9049 0.9207 0.9345 0.9463 0.9564 0.9649 0.9719 0.9778 0.9826 0.9864 0.9896 0.9920 0.9940 0.9955 00966 0.9975 0.9982 00987 0.01 0.8461 0.8686 0.8888 0.9066 0.9222 0.9357 0.9474 0.9573 0.9656 0.9726 0.9783 0.9830 0.9868 0.9898 0.9922 0.9941 0.9956 0.9967 0.9976 0.9982 0.9987 0.0082 0.9236 0.9370 0.9484 0.9582 0.9664 0.9732 0.9788 0.9834 0.9871 0.9901 0.9925 0.9943 0.9937 0.9968 0.9977 0.9983 0.9988 0.03 0.8531 0.8749 0.8944 0.9115 0.9265 0.9394 0.9505 0.9599 0.9678 0.9744 0.9798 0.9842 0.9878 0.9906 0.9929 0.9946 0.9960 0.9970 0.9978 0.9984 0.9989 0.05 0.9099 0.9251 0.9382 0.9495 0.9591 0.9671 0.9738 0.9793 0.9838 0.9875 0.9904 0.9927 0.9945 0.9959 0.9969 0.9977 0.9984 0.9988 0.04 0.8554 0.8770 0.8962 0.9131 0.9279 0.9406 0.9515 0.9608 0.9686 0.9750 0.0803 0.9846 0.9881 0.9909 0.9931 0.0948 0.9961 0.9971 0.9979 0.9985 0.9989 0.06 0.8577 0.8599 0.8790 0.8810 0.8980 0.8997 0.9147 0.9162 0.9292 0.9306 0.9418 0.9429 0.9525 0.9535 9616 0.9625 0.9693 0.9699 0.9756 0.9761 0.9808 0.9812 0.9850 0.9854 0.9884 0.9887 0.9911 0.9913 0.9932 0.9934 0.9949 0.9951 0.9962 0.9063 0.9972 0.9973 0.9979 0.9980 0.9985 0.9986 0.9989 0.9990 0.07 0.08 0.8621 0.8830 0.9015 0.9177 0.9319 0.9441 0.9545 0.9633 0.9706 0.9767 0.9817 0.9857 0.9890 0.9916 0.9936 0.9952 0.9964 0.9974 0.9981 0.9986 0.9990 0.09 22 1.3 1.4 1.5 1.6 1.7 1.8 1.9 2.0 2.1 22 23 24 2.5 2.6 2.7 28 29 23 2.4 25 2.6 2.7 28 2.9 3.0 3.0 2 0.02 A random variable follows the normal probability distribution with a mean of 116 and a standard deviation of 31. Complete parts (a) through (d) below. Click here to view Rage 1 of the standard normal probability table. Click here to view.pane Zof the standard normal probability tabla a) What is the probability that a randomly selected value from this population is between 93 and 1337 (Round to four decimal places as needed)
Step by Step Solution
There are 3 Steps involved in it

Get step-by-step solutions from verified subject matter experts