

Question: Current Attempt in Progress $40 30 Utility Costs 20 10 0 Yes 0 strictly variable cost 2 Activity Scatter Plot The activity does appear to
Current Attempt in Progress $40 30 Utility Costs 20 10 0 Yes 0 strictly variable cost 2 Activity Scatter Plot The activity does appear to be linear. 4 Number of Units Produced 6 Given the above scatter plot, does the activity appear to reflect a linear relationship? 8 Does the activity reflect a strictly variable cost, a strictly fixed cost, or a mixed cost? 10 Is there a cause-and-effect relationship between these two variables?
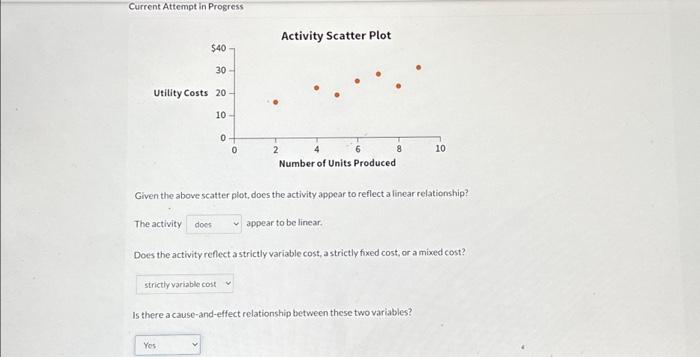
Current Attempt in Progress Given the above seatter plot, does the activity appear to reflect a linear relationship? The activity appear to be linear. Does the activity reflect a strictly variable cost, a strictly fixed cost, or a mixed cost? Is there a cause-and-effect relationship between these two variables
Step by Step Solution
There are 3 Steps involved in it
1 Expert Approved Answer
Step: 1 Unlock

Question Has Been Solved by an Expert!
Get step-by-step solutions from verified subject matter experts
Step: 2 Unlock
Step: 3 Unlock