

Question: Current Attempt in Progress Operating data for Bridgeport Corp. are presented as follows. Sales revenue Cost of goods sold Selling expenses Administrative expenses Income tax
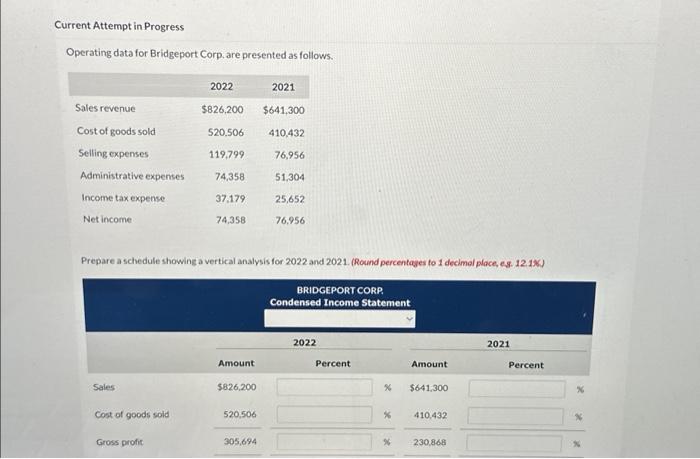
Current Attempt in Progress Operating data for Bridgeport Corp. are presented as follows. Sales revenue Cost of goods sold Selling expenses Administrative expenses Income tax expense Net income Sales Cost of goods sold 2022 Gross profit $826,200 520,506 119,799 74,358 37,179 74,358 Amount $826,200 520,506 2021 Prepare a schedule showing a vertical analysis for 2022 and 2021. (Round percentages to 1 decimal place, e.g. 12.1%.) 305,694 $641,300 410,432 76,956 51,304 25,652 76,956 BRIDGEPORT CORP. Condensed Income Statement 2022 Percent % % % Amount $641,300 410,432 230,868 2021 Percent % % %
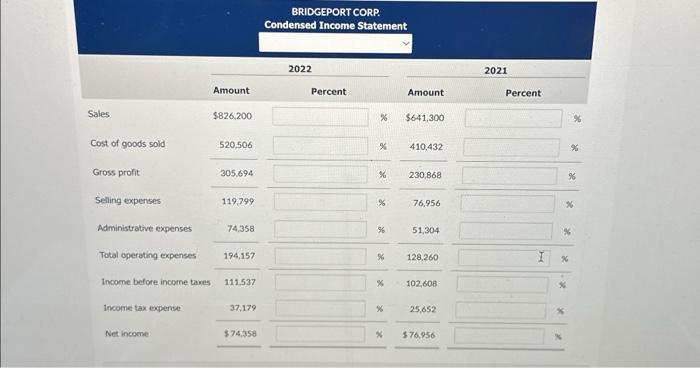
BRIDGEPORT CORP. Condensed Income Statement 2022 Amount $826,200 Cost of goods sold Gross profit Seling expenses Administrative expenses Total operating expenses Income before income taves Income tax experse Net income Percent \begin{tabular}{|c|} \hline 520,506 \\ \hline 305,694 \\ \hline 119,799 \\ \hline \end{tabular} 74.358 Amount \% $641,300 \& 410,432 2021 Percent 174,157 111.537 \% 230,868 \% 76,956 \% 51,304 \% 128,260 * 102,608: 37,179374,358
Step by Step Solution
There are 3 Steps involved in it
1 Expert Approved Answer
Step: 1 Unlock

Question Has Been Solved by an Expert!
Get step-by-step solutions from verified subject matter experts
Step: 2 Unlock
Step: 3 Unlock