

Question: Current Attempt in Progress Suppose this information is available for PepsiCo, Inc. for 2015, 2016, and 2017 2015 2016 2017 $2,100 $2,300 $2,300 (in millions
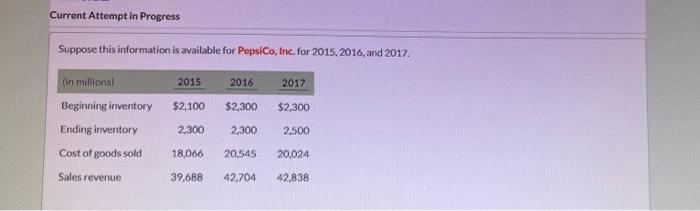
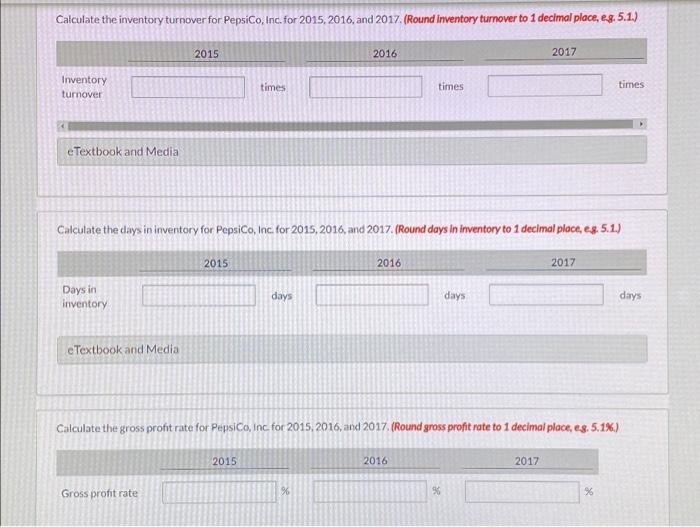
Current Attempt in Progress Suppose this information is available for PepsiCo, Inc. for 2015, 2016, and 2017 2015 2016 2017 $2,100 $2,300 $2,300 (in millions Beginning inventory Ending inventory Cost of goods sold 2,300 2,300 2,500 18,066 20,545 20,024 Sales revenue 39.688 42.704 42,838 Calculate the inventory turnover for PepsiCo, Inc. for 2015, 2016, and 2017. (Round Inventory turnover to 1 decimal place, e8.5.1.) 2015 2016 2017 Inventory turnover times times times e Textbook and Media Calculate the days in inventory for PepsiCo, Inc. for 2015, 2016, and 2017. (Round days in inventory to 1 decimal place, es. 5.1.) 2015 2016 2017 Days in inventory days days days c Textbook and Media Calculate the gross profit rate for PepsiCo, Inc for 2015, 2016, and 2017. (Round gross profit rate to 1 decimal place, c.8.5.1%) 2015 2016 2017 Gross profit rate % 55 %
Step by Step Solution
There are 3 Steps involved in it

Get step-by-step solutions from verified subject matter experts