

Question: Current Attempt in Progress The table below gives sales, in billions of dollars, of Pepsico, which operates two major businesses: beverages (including Pepsi) and snack
Current Attempt in Progress
The table below gives sales, in billions of dollars, of Pepsico, which operates two major businesses: beverages (including Pepsi) and snack foods.1
| Year | 2007 | 2008 | 2009 | 2010 | 2011 | 2012 |
|---|---|---|---|---|---|---|
| Sales | 39.47 | 43.25 | 43.23 | 57.84 | 66.50 | 65.49 |
| Year | 2013 | 2014 | 2015 | 2016 | 2017 | 2018 |
| Sales | 66.42 | 66.68 | 63.06 | 62.80 | 63.53 | 64.66 |
(a) Find the change in sales between 2010 and 2018.
billion dollars
(b) Find to 2 decimal places the average rate of change in sales between 2010 and 2018. Give units and interpret your answer.
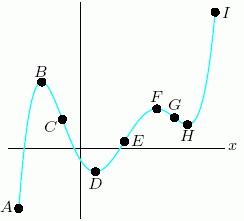
For which pairs of consecutive points, in the figure below, is the function graphed increasing and concave up?
Step by Step Solution
There are 3 Steps involved in it
1 Expert Approved Answer
Step: 1 Unlock

Question Has Been Solved by an Expert!
Get step-by-step solutions from verified subject matter experts
Step: 2 Unlock
Step: 3 Unlock