

Question: Current Position Analysis The following data were taken from the comparative balance sheet of Icon Living, Inc., for the years ended December 31, 2019 and
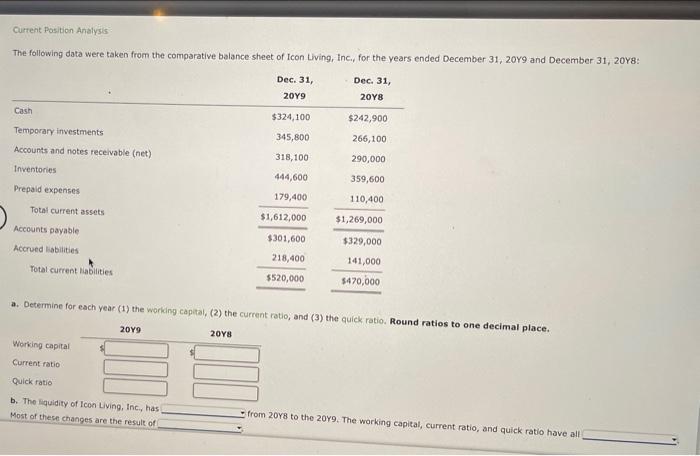
Current Position Analysis The following data were taken from the comparative balance sheet of Icon Living, Inc., for the years ended December 31, 2019 and December 31, 2018 Dec. 31, 2019 Dec. 31, 20Y8 Cash $324,100 $242,900 Temporary investments 345,800 266,100 Accounts and notes receivable (net) 318,100 290,000 Inventories 444,600 359,600 Prepaid expenses 179,400 110,400 Total current assets $1,612,000 $1,269,000 Accounts payable Accrued abilities $301,600 218,400 $520,000 $329,000 141,000 $470,000 Total current liabilities .. Determine for each year (1) the working capital, (2) the current ratio, and (3) the quick ratio. Round ratios to one decimal place. 2019 Working capital 20Y8 Current ratio Quick ratio b. The liquidity of Icon Living, Inc., has Most of these changes are the result of from 2018 to the 2049. The working capital, current ratio, and quick ratio have all
Step by Step Solution
There are 3 Steps involved in it

Get step-by-step solutions from verified subject matter experts