Question: Current Prior Consolidated Balance Sheet ($ millions) year year Current assets Cash and cash equivalents $21,281 $33, 193 Marketable securities 22, 192 26,314 Accounts receivable,
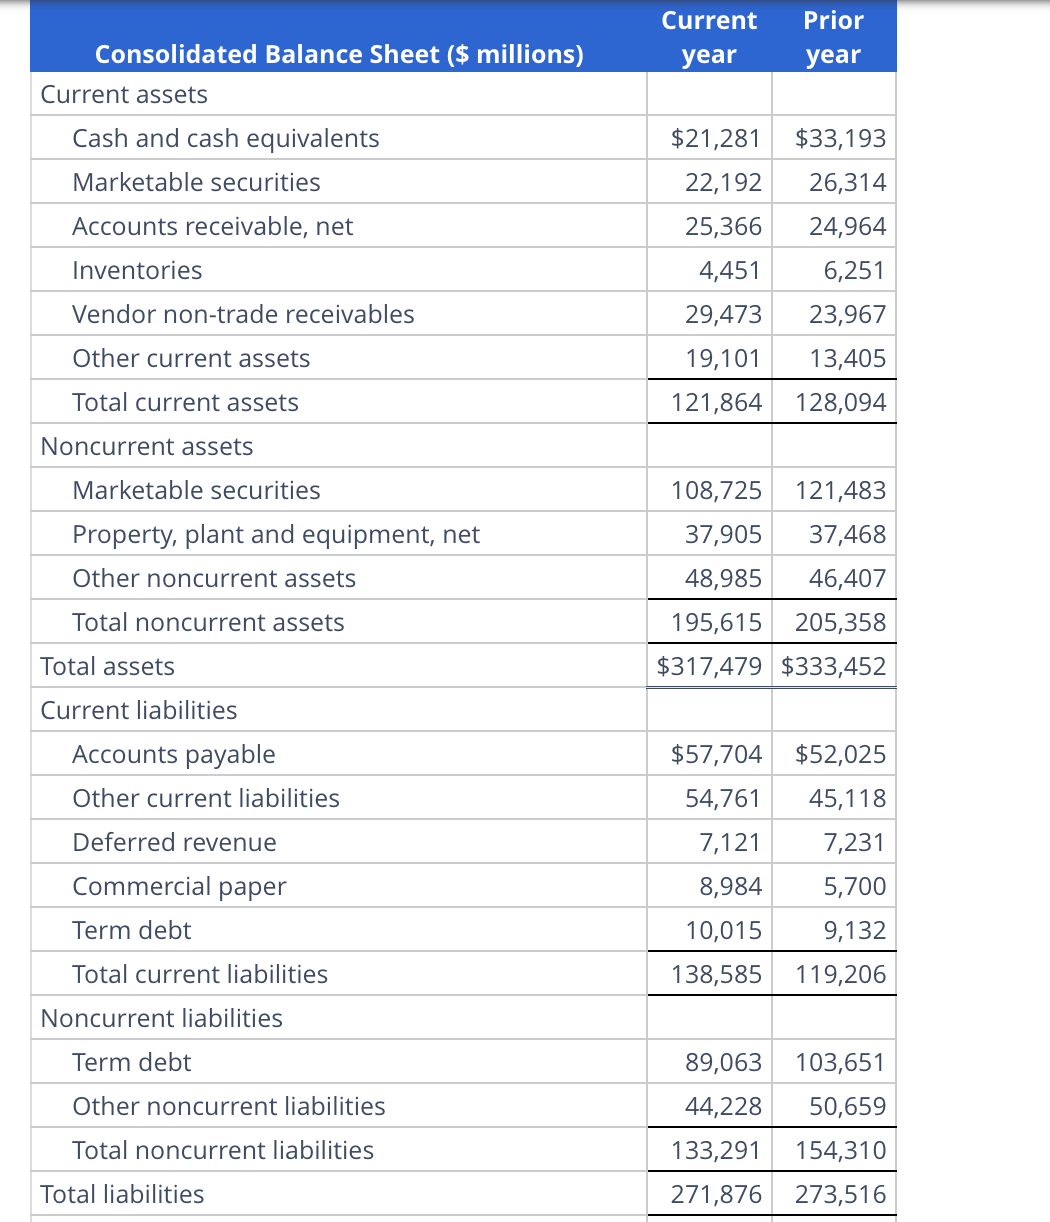
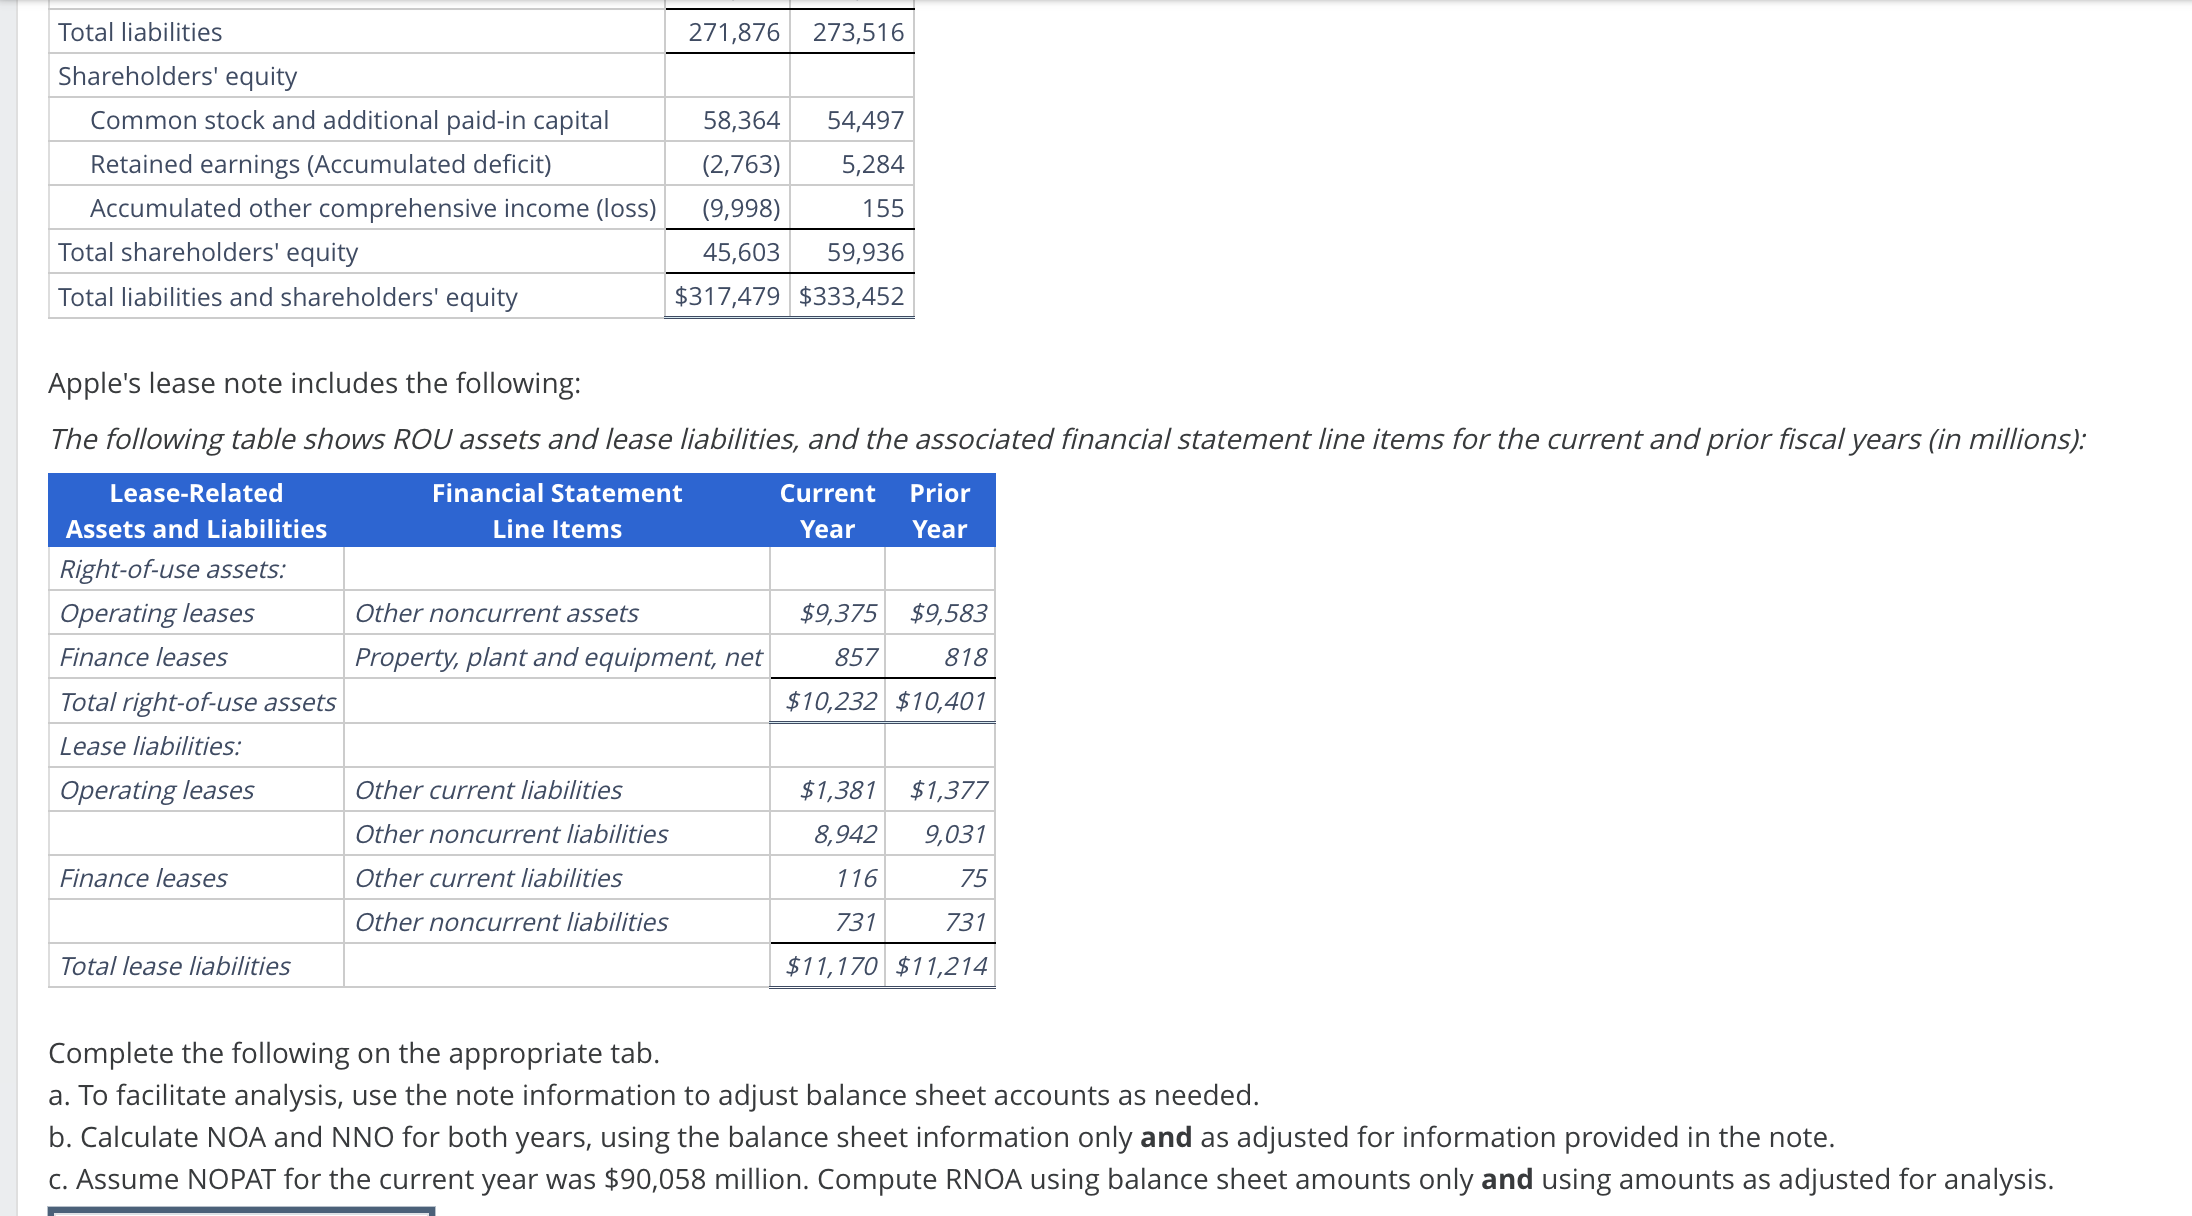
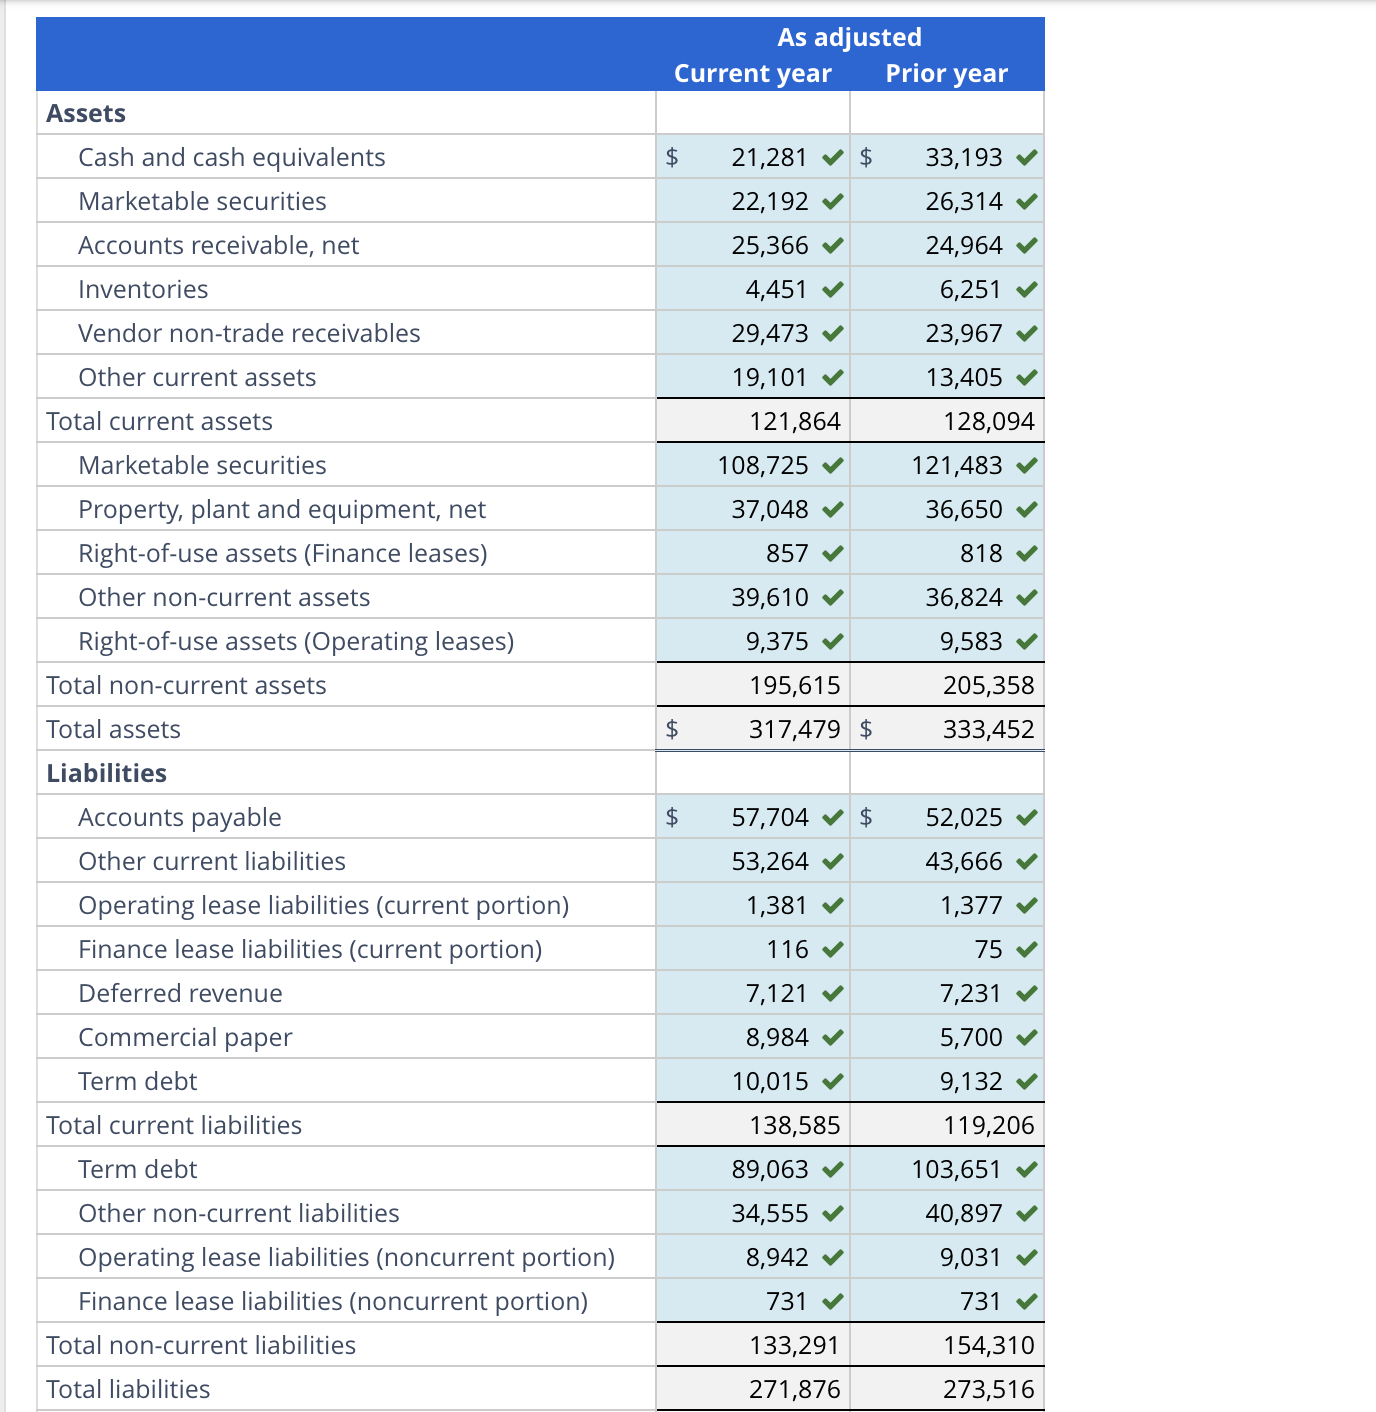
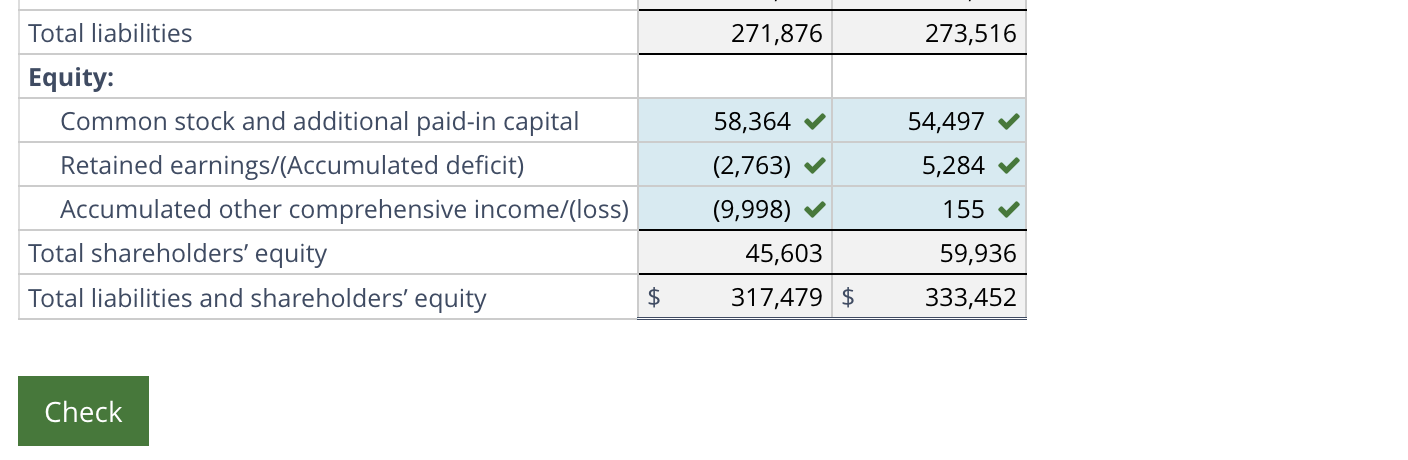
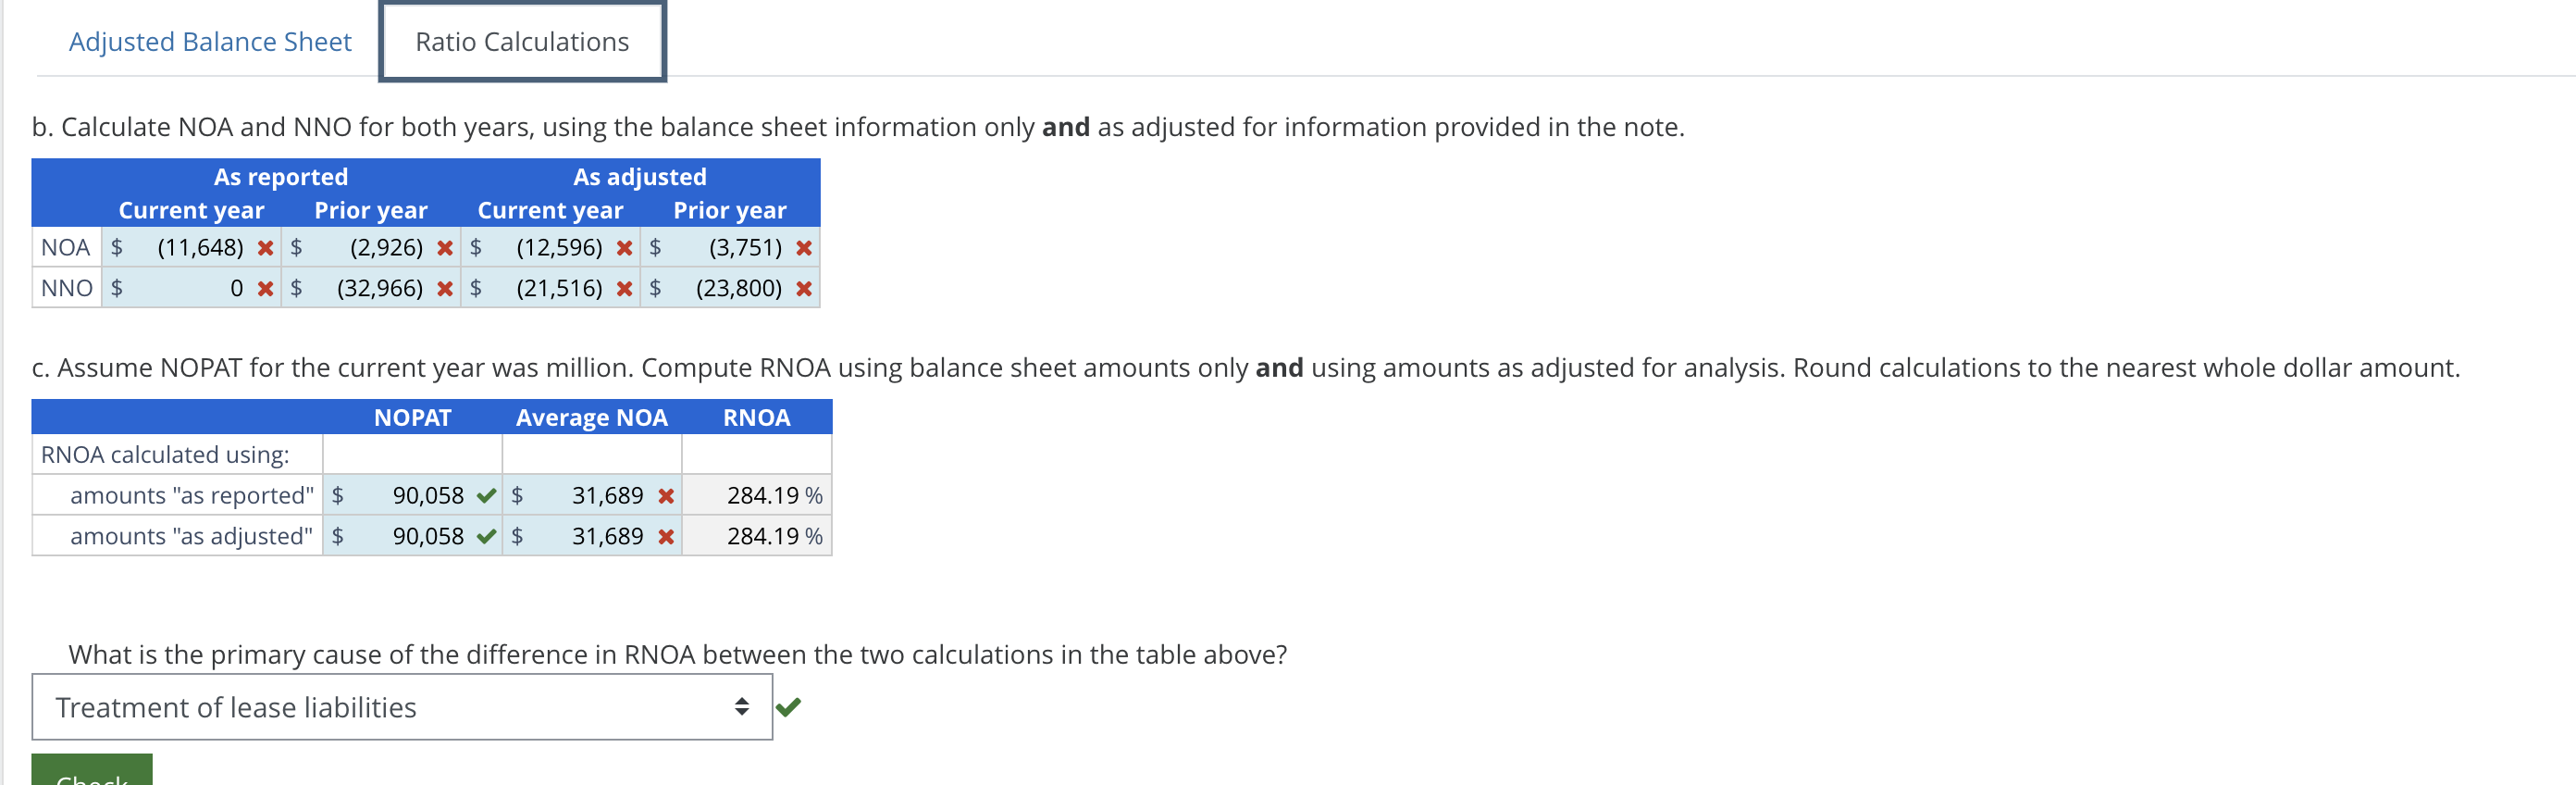
Current Prior Consolidated Balance Sheet ($ millions) year year Current assets Cash and cash equivalents $21,281 $33, 193 Marketable securities 22, 192 26,314 Accounts receivable, net 25,366 24,964 Inventories 4,451 6,251 Vendor non-trade receivables 29,473 23,967 Other current assets 19, 101 13,405 Total current assets 121,864 128,094 Noncurrent assets Marketable securities 108,725 121,483 Property, plant and equipment, net 37,905 37,468 Other noncurrent assets 48,985 46,407 Total noncurrent assets 195,615 205,358 Total assets $317,479 $333,452 Current liabilities Accounts payable $57,704 $52,025 Other current liabilities 54,761 45, 1 18 Deferred revenue 7,121 7,231 Commercial paper 8,984 5,700 Term debt 10,015 9,132 Total current liabilities 138,585 1 19,206 Noncurrent liabilities Term debt 89,063 103,651 Other noncurrent liabilities 44,228 50,659 Total noncurrent liabilities 133,291 154,310 Total liabilities 271,876 273,516Total liabilities 271,876 273,516 Shareholders' equity Common stock and additional paid-in capital 58364 54,497 Retained earnings (Accumulated deficit) (2,763) 5,284 Accumulated other comprehensive income (loss) (9,998) 155 Total shareholders' equity 45,603 59,936 Total liabilities and shareholders' equity $317,479 $333,452 Apple's lease note includes the following: The following table shows ROU assets and lease liabilities, and the associated financial statement line items for the current and prior fiscal years (in millions): Lease-Related Financial Statement Current Prior (AL NI Year Year Right-of-use assets: Operating leases Other noncurrent assets $9,375 $9,583 Finance leases Property, plant and equipment, net 857 818 Total right-of-use assets $10,232 $10,401 Lease liabilities: Operating leases Other current liabilities $1,381 $1,377 Other noncurrent liabilities 8942 9,031 Finance leases Other current liabilities 116 75 Other noncurrent liabilities 731 731 Total lease liabilities $11,170 $11,214 Complete the following on the appropriate tab. a. To facilitate analysis, use the note information to adjust balance sheet accounts as needed. b. Calculate NOA and NNO for both years, using the balance sheet information only and as adjusted for information provided in the note. c. Assume NOPAT for the current year was $90,058 million. Compute RNOA using balance sheet amounts only and using amounts as adjusted for analysis. Assets Cash and cash equivalents Marketable securities Accounts receivable, net Inventories Vendor non-trade receivables Other current assets Total current assets Marketable securities Property, plant and equipment, net Right-of-use assets (Finance leases) Other non-current assets Right-of-use assets (Operating leases) Total non-current assets Total assets Liabilities Accounts payable Other current liabilities Operating lease liabilities (current portion) Finance lease liabilities (current portion) Deferred revenue Commercial paper Term debt Total current liabilities Term debt Other non-current liabilities Operating lease liabilities (noncurrent portion) Finance lease liabilities (noncurrent portion) Total non-current liabilities Total liabilities As adjusted Current year Prior year 21,281 33,193 22,192 26,314 # 25,366 v 24964 v 4451 6,251 29473 23967 v 19,101 + 13,405 + 121,864 128,094 108,725 v 121,483 v 37,048 v 36,650 v 857 v 818 v 39,610 v 36,824 v 9,375 v 9,583 v 195,615 205,358 317,479 $ 333,452 57,704 v $ 52,025 v 53,264 v 43,666 v 1,381 v 1377 v 116 v 75 v 7121 v 7231 v 8,984 v 5,700 v 10,015 + 9,132 v 138,585 119,206 89,063 v 103,651 34,555 v 40,897 8942 v 9,031 v 731 731 133,291 154,310 271,876 273,516 Total liabilities Equity: Common stock and additional paid-in capital Retained earnings/(Accumulated deficit) Accumulated other comprehensive income/(loss) Total shareholders' equity Total liabilities and shareholders' equity $ 271,876 58,364 v (2,763) v (9,998) v 45,603 317,479 273,516 54,497 5284 v 155 59,936 333,452 Adjusted Balance Sheet Ratio Calculations b. Calculate NOA and NNO for both years, using the balance sheet information only and as adjusted for information provided in the note. As reported As adjusted Current year Prior year Current year Prior year NOA $ (11,648) * $ (2,926) * $ (12,596) * $ (3,751) X NNO $ ox $ (32,966) * $ (21,516) * $ (23,800) X c. Assume NOPAT for the current year was million. Compute RNOA using balance sheet amounts only and using amounts as adjusted for analysis. Round calculations to the nearest whole dollar amount. NOPAT Average NOA RNOA RNOA calculated using: amounts "as reported" |$ 90,058 ~ $ 31,689 x 284. 19 % amounts "as adjusted" $ 90,058 V $ 31,689 X 284.19 % What is the primary cause of the difference in RNOA between the two calculations in the table above? Treatment of lease liabilities
Step by Step Solution
There are 3 Steps involved in it
1 Expert Approved Answer
Step: 1 Unlock
Question Has Been Solved by an Expert!
Get step-by-step solutions from verified subject matter experts
Step: 2 Unlock
Step: 3 Unlock
Students Have Also Explored These Related Accounting Questions!