

Question: Current Ratio The following financial data is from Hi-Tech Instruments' financial statements (thousands of dollars, except earnings per share.) 2016 Sales revenue Cost of goods
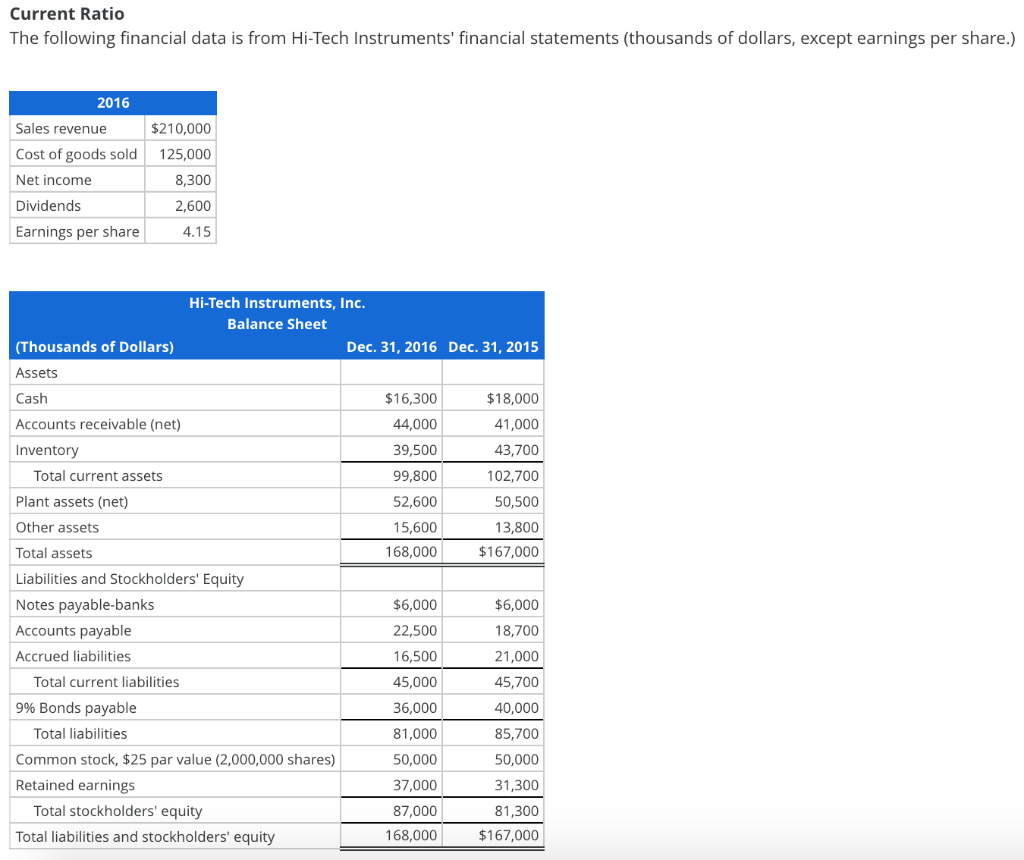
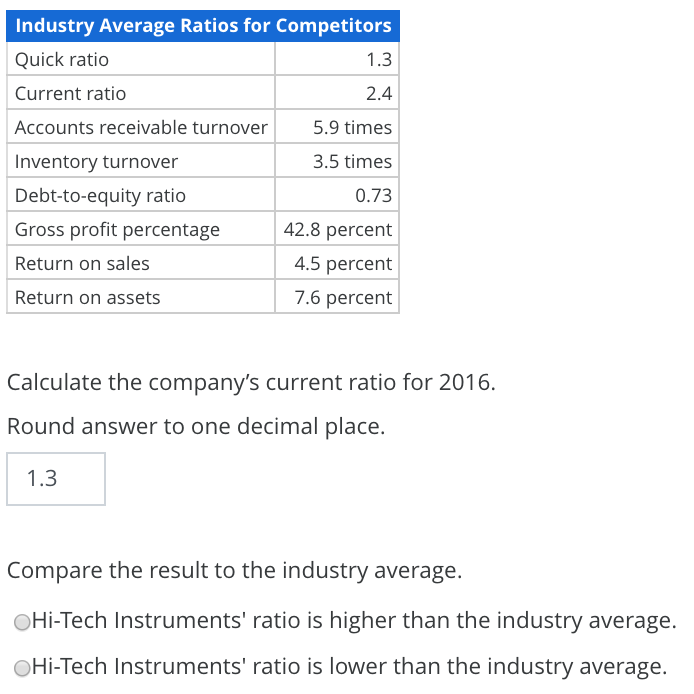
Current Ratio The following financial data is from Hi-Tech Instruments' financial statements (thousands of dollars, except earnings per share.) 2016 Sales revenue Cost of goods sold Net income Dividends Earnings per share $210,000 125,000 8,300 2,600 4.15 Hi-Tech Instruments, Inc. Balance Sheet Dec. 31, 2016 Dec. 31, 2015 (Thousands of Dollars) Assets $16,300 44,000 39,500 99,800 52,600 15,600 168,000 $18,000 41,000 43,700 102,700 50,500 13.800 $167,000 Cash Accounts receivable (net) Inventory Total current assets Plant assets (net) Other assets Total assets Liabilities and Stockholders' Equity Notes payable-banks Accounts payable Accrued liabilities Total current liabilities 9% Bonds payable Total liabilities Common stock, $25 par value (2,000,000 shares) Retained earnings Total stockholders' equity Total liabilities and stockholders' equity $6,000 22,500 16,500 45,000 36,000 81,000 50,000 37,000 87,000 168,000 $6,000 18,700 21,000 45,700 40,000 85,700 50,000 31,300 81,300 $167,000 Industry Average Ratios for Competitors Quick ratio 1.3 Current ratio 2.4 Accounts receivable turnover Inventory turnover 5.9 times 3.5 times 0.73 Debt-to-equity ratio Gross profit percentage Return on sales 42.8 percent 4.5 percent 7.6 percent Return on assets Calculate the company's current ratio for 2016. Round answer to one decimal place. 1.3 Compare the result to the industry average. Hi-Tech Instruments' ratio is higher than the industry average. Hi-Tech Instruments' ratio is lower than the industry average
Step by Step Solution
There are 3 Steps involved in it

Get step-by-step solutions from verified subject matter experts