

Question: Curse name :advanced statistical quality control a) A single sampling plan will be designed with a Binomial Nomograph. What should the n and c values
Curse name :advanced statistical quality control
a) A single sampling plan will be designed with a Binomial Nomograph. What should the n and c values be for p1=0.02 (AQL), =0.10, p2=0.10 (LTPD), and =0.10?
b) For N=4000, n=100 and c=5 in a sampling plan using corrective examination, calculate the AOQL value approximately from the graph by drawing a p-AOQ curve similar to figure 8.6 in the book with the help of Excel or a similar package program. (Note: Calculate Pa using different p values. Calculate AOQ using P, Pa, N, and n values. Find the AOQL value at the maximum point by plotting the AOQ graph by putting the p values on the x-axis and the AOQ values on the y-axis). Explain the result in a few sentences.
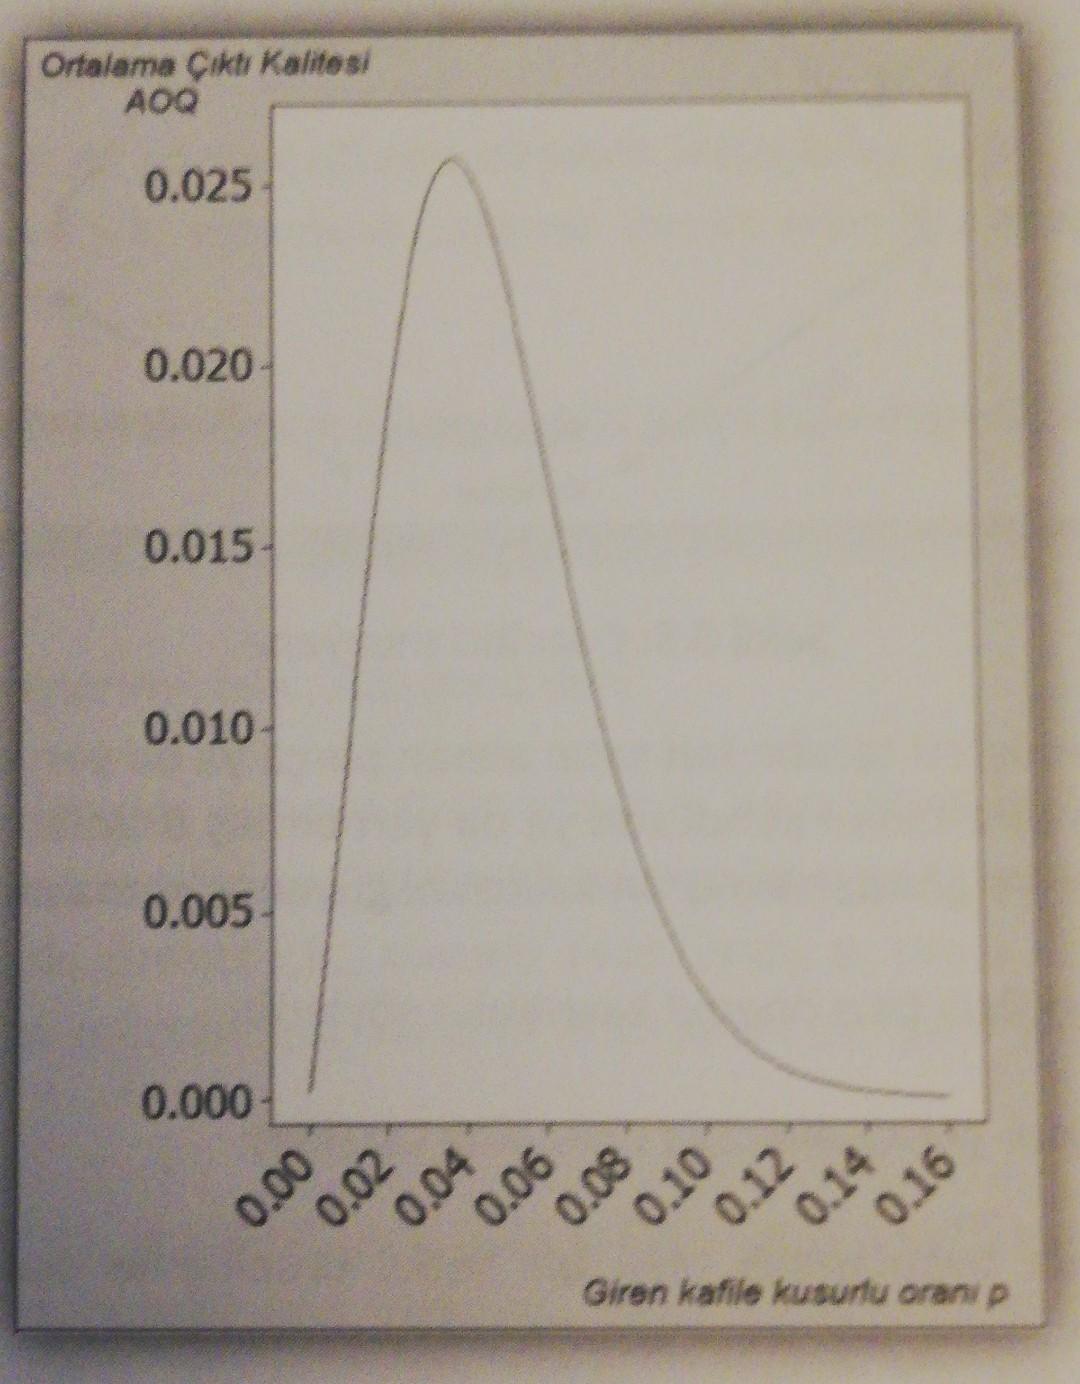
Ortalama kt Kalitesi AOQ 0.025 0.020 0.015- 0.010 0.005 0.000 0.16 0.14 0.12 0.10 0.08 0.06 0.04 0.02 0.00 Giren kafile kusurlu oran p Ortalama kt Kalitesi AOQ 0.025 0.020 0.015- 0.010 0.005 0.000 0.16 0.14 0.12 0.10 0.08 0.06 0.04 0.02 0.00 Giren kafile kusurlu oran p
Step by Step Solution
There are 3 Steps involved in it

Get step-by-step solutions from verified subject matter experts