

Question: Cutting Edge Mark Lawrence has been pursuing a vision for more than two years. This pursuit began when he became frustrated in his role as
Cutting Edge
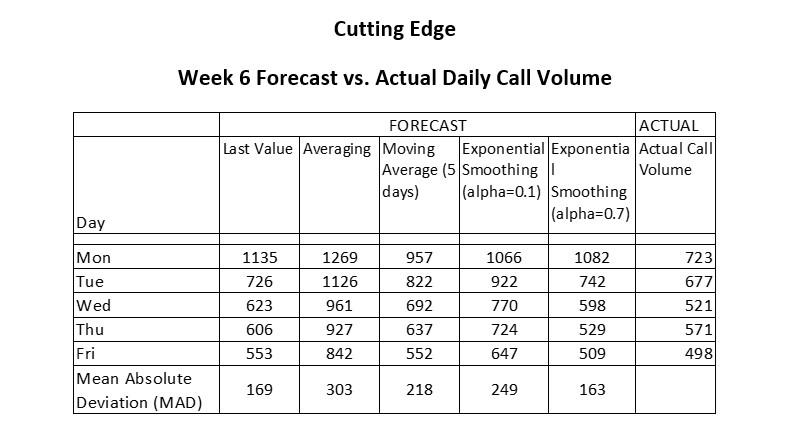
Mark Lawrence has been pursuing a vision for more than two years. This pursuit began when he became frustrated in his role as director of Human Resources at Cutting Edge, a large company manufacturing computers and computer peripherals. At that time the Human Resources Department under his direction provided records and benefits administration to the 60,000 Cutting Edge employees throughout the United States, and 35 separate records and benefits administration centers existed across the country. Employees contact these records and benefits centers to obtain information about dental plans and stock options, change tax forms and personal information, and process leaves of absence and retirements. The decentralization of these administration centers caused numerous headaches for Mark. He had to deal with employee complaints often since each center interpreted company policies differently communicating inconsistent and sometimes inaccurate answers to employees. His department also suffered high operating costs since operating 35 separate centers created inefficiency. His vision? To centralize records and benefits administration by establishing one administration center. This centralized records and benefits administration center would perform two distinct functions: data management and customer service. The data management function would include updating employee records after performance reviews and maintaining the human resource management system. The customer service function would include establishing a call center to answer employee questions concerning records and benefits and to process records and benefits changes over the phone. One year after proposing his vision to management, Mark received the go-ahead from Cutting Edge corporate headquarters. He prepared his to do list specifying computer and phone systems requirements, installing hardware and software, integrating data from the 35 separate administration centers, standardizing record-keeping and response procedures, and staffing the administration center. Mark delegated the systems requirements, installation, and integration jobs to a competent group of technology specialists. He took on the responsibility of standardizing procedures and staffing the administration center. Mark had spent many years in human resources and therefore had little problem with standardizing record-keeping and response procedures. He encountered trouble in determining the number of representatives needed to staff the center, however. He was particularly worried about staffing the call center since the representatives answering phones interact directly with customers the 60,000 Cutting Edge employees. The customer service representatives would receive extensive training so that they would know the records and benefits policies backwards and forwards enabling them to answer questions accurately and process changes efficiently. Overstaffing would cause Mark to suffer the high costs of training unneeded representatives and paying the surplus representatives the high salaries that go along with such an intense job. Understaffing would cause Mark to continue to suffer the headaches from customer complaints something he definitely wanted to avoid. The number of customer service representatives Mark needed to hire depended on the number of calls that the records and benefits call center would receive. Mark therefore needed to forecast the number of calls that the new centralized center would receive. He approached the forecasting problem by using judgmental forecasting. He studied data from one of the 35 decentralized administration centers and learned that the decentralized center had serviced 15,000 customers and had received 2,000 calls per month. He concluded that since the new centralized center would service four times the number of customers 60,000 customers it would receive four times the number of calls 8,000 calls per month. Mark slowly checked off the items on his to do list, and the centralized records and benefits center opened one year after Mark had received the go-ahead from corporate headquarters. Now, after operating the new center for 13 weeks, Marks call center forecasts are proving to be terribly inaccurate. The number of calls the center receives is roughly three times as large as the 8,000 calls per month that Mark had forecasted. Because of demand overload, the call center is slowly going to hell in a handbasket. Customers calling the center must wait an average of five minutes before speaking to a representative, and Mark is receiving numerous complaints. At the same time, the customer service representatives are unhappy and on the verge of quitting because of the stress created by the demand overload. Even corporate headquarters has become aware of the staff and service inadequacies, and executives have been breathing down Marks neck demanding improvements. Mark needed help, and he approached Harry, a corporate analyst, to forecast demand for the call center more accurately. Luckily, when Mark first established the call center, he realized the importance of keeping operational data, and he provided Harry with the number of calls received on each day of the week over the last 13 weeks. The data (refer to Cutting Edge Student File No. 1) begins in week 44 of the last year (2012) and continues to week 5 of the current year (2013). Mark indicates that the days where no calls were received were holidays. As a start, Harry used the data from the past 13 weeks and applied five different time-series forecasting methods in preparing a trial forecast of the call volume for each day of the upcoming week (Week 6). He provided a different forecast for each day of the week by treating the forecast for a single day as being the actual call volume on that day. From plotting the data, Harry could see that demand follows seasonal patterns within the week. For example, more employees call at the beginning of the week when they are fresh and productive than at the end of the week when they are planning for the weekend. Therefore, Mark prepared and used seasonally adjusted call volumes for the past 13 weeks. After Week 6 ended, Harry compared the five forecasts with the actual volumes and calculated the Mean Absolute Deviation (MAD) values for each method. The result of Harrys work is summarized below:
Cutting Edge Week 6 Forecast vs. Actual Daily Call Volume (Data from Student File 1)
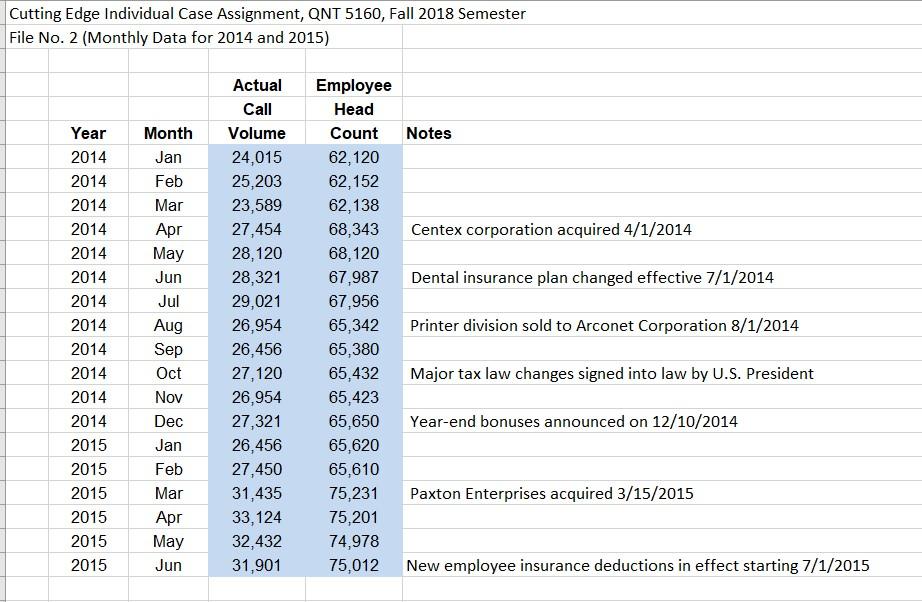
After many months of work and with Harrys help, Mark has been able to stabilize the call center operation. Mark now has a better handle on how to forecast the daily call demand and he is able to prepare effective weekly staffing schedules for handling the daily variation in volume. However, Mark is still experiencing difficulty in forecasting the volume from month to month. Cutting Edge has been very active in acquiring new companies while, at the same time, selling off portions of their existing business. Mark believes that this activity is causing fluctuations in call volume because it is affecting the employee head count of Cutting Edge. Mark has assembled monthly data for call volume and head count for the past 18 months (refer to Cutting Edge Student File No. 2). Mark also suspects that there are other factors which may be affecting the call volume, and he has noted these factors on the attached spreadsheet. Based on the upcoming acquisition of Cutter Corp on 7/1/2015, the forecast of head count for July 2015 is 77,000.
(Cutting Edge Student File No. 2)
Part 2
Part 2 (5 points):
In answering the Part 2 questions, you should download and refer to Student Data File No. 1 which contains the historical data that was used in preparing the forecast results that are reported in Part 2 of the case write-up document. Note that you do not have to prepare any forecasts in answering this question. Hint: it will be helpful for you to review a time-series plot of the 13 weeks of data contained on Student Data File No. 1.
Question 2a (0.8 points): Describe the details of the Last Value method used by Harry and explain its accuracy (MAD value) in comparison with the accuracy of the other methods.
Question 2b (0.8 points): Describe the details of the Averaging method used by Harry and explain its accuracy (MAD value) in comparison with the accuracy of the other methods.
Question 2c (0.8 points): Describe the details of the Moving Average (5 days) method used by Harry and explain its accuracy (MAD value) in comparison with the accuracy of the other methods.
Question 2d (0.8 points): Describe the details of the Exponential Smoothing (alpha = 0.1) method used by Harry and explain its accuracy (MAD value) in comparison with the accuracy of the other methods.
Question 2e (0.8 points): Describe the details of the Exponential Smoothing (alpha = 0.7) method used by Harry and explain its accuracy (MAD value) in comparison with the accuracy of the other methods.
Question 2f (1 point): Based on the analysis above, provide your recommendations to Mark on daily call volume forecasting to improve the scheduling of the call enter staff.
Cutting Edge Week 6 Forecast vs. Actual Daily Call Volume FORECAST ACTUAL Last Value Averaging Moving Exponential Exponentia Actual Call Average (5 Smoothing Volume days) (alpha=0.1) Smoothing (alpha=0.7) Day Mon 1066 1269 1126 Tue 1135 726 623 606 553 957 822 692 961 922 770 724 647 Wed Thu Fri Mean Absolute Deviation (MAD) 1082 742 598 529 509 723 677 521 571 498 927 637 842 552 169 303 218 249 163 Cutting Edge Individual Case Assignment, QNT 5160, Fall 2018 Semester File No. 2 (Monthly Data for 2014 and 2015) Notes Centex corporation acquired 4/1/2014 Dental insurance plan changed effective 7/1/2014 Year 2014 2014 2014 2014 2014 2014 2014 2014 2014 2014 2014 2014 2015 2015 2015 2015 2015 2015 Actual Call Volume 24,015 25,203 23,589 27,454 28,120 28,321 29,021 26,954 26,456 27,120 26,954 27,321 26,456 27,450 31,435 33,124 32,432 31,901 Month Jan Feb Mar Apr May Jun Jul Aug Sep Oct Nov Dec Jan Feb Mar Apr May Jun Printer division sold to Arconet Corporation 8/1/2014 Employee Head Count 62,120 62,152 62,138 68,343 68,120 67,987 67,956 65,342 65,380 65,432 65,423 65,650 65,620 65,610 75,231 75,201 74,978 75,012 Major tax law changes signed into law by U.S. President Year-end bonuses announced on 12/10/2014 Paxton Enterprises acquired 3/15/2015 New employee insurance deductions in effect starting 7/1/2015Step by Step Solution
There are 3 Steps involved in it

Get step-by-step solutions from verified subject matter experts