

Question: d 9 19 1 point The table below shows the annual percentage change in sales for five locations of J&J Burger. Pct. Change, 2019- Pct.
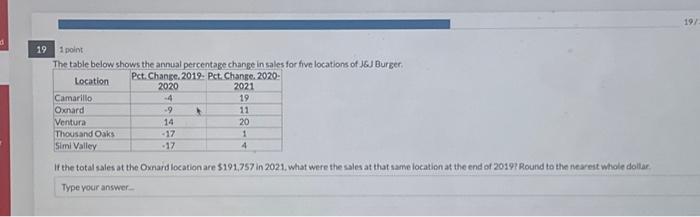
d 9 19 1 point The table below shows the annual percentage change in sales for five locations of J&J Burger. Pct. Change, 2019- Pct. Change, 2020- Location 2020 2021 -4 19 -9 11 14 20 -17 1 -17 4 Camarillo Oxnard Ventura Thousand Oaks Simi Valley If the total sales at the Oxnard location are $191,757 in 2021, what were the sales at that same location at the end of 2019? Round to the nearest whole dollar. Type your answer.... A 19/:
1 point The table below shows the annual percentage chanse in sales for five locations of JGJ Burger. If the total sales at the Oxnard location are 5191,757 in 2021, What were the sales at that same iocatien at the end of 20197 Rourd to the nearest whole dollar. Type yocir
Step by Step Solution
There are 3 Steps involved in it
1 Expert Approved Answer
Step: 1 Unlock

Question Has Been Solved by an Expert!
Get step-by-step solutions from verified subject matter experts
Step: 2 Unlock
Step: 3 Unlock