

Question: d. Are there any factors which could be contributing to the amount of each type of fruit that is produced which the farmer has not
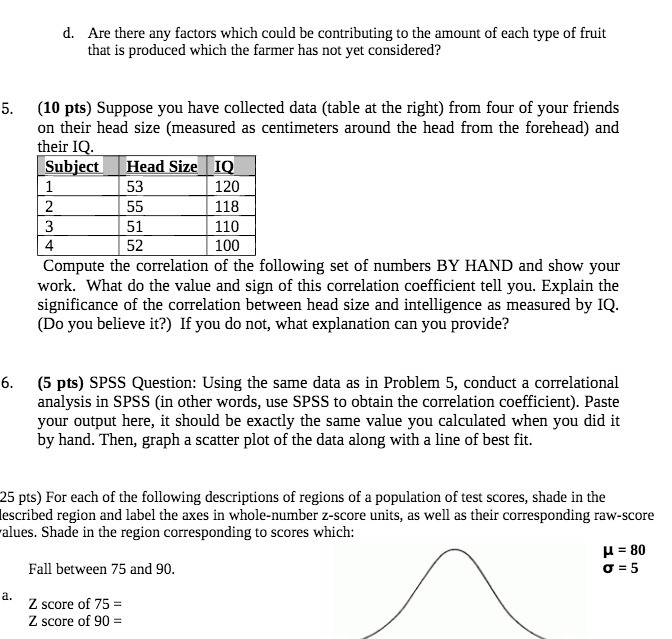
d. Are there any factors which could be contributing to the amount of each type of fruit that is produced which the farmer has not yet considered? 5. (10 pts) Suppose you have collected data (table at the right) from four of your friends on their head size (measured as centimeters around the head from the forehead) and their IQ. Subject Head Size IQ 1 53 120 2 55 118 3 51 110 4 52 100 Compute the correlation of the following set of numbers BY HAND and show your work. What do the value and sign of this correlation coefficient tell you. Explain the significance of the correlation between head size and intelligence as measured by IQ. (Do you believe it?) If you do not, what explanation can you provide? 6. (5 pts) SPSS Question: Using the same data as in Problem 5, conduct a correlational analysis in SPSS (in other words, use SPSS to obtain the correlation coefficient). Paste your output here, it should be exactly the same value you calculated when you did it by hand. Then, graph a scatter plot of the data along with a line of best fit. 25 pts) For each of the following descriptions of regions of a population of test scores, shade in the escribed region and label the axes in whole-number z-score units, as well as their corresponding raw-score alues. Shade in the region corresponding to scores which: H = 80 Fall between 75 and 90. 0 =5 a. Z score of 75 = Z score of 90 =
Step by Step Solution
There are 3 Steps involved in it

Get step-by-step solutions from verified subject matter experts