

Question: D ata s heet Name: Group: Date experiment performed: Introduction Question: Answer to question a) Why is the surface of a conductor always an equiporential

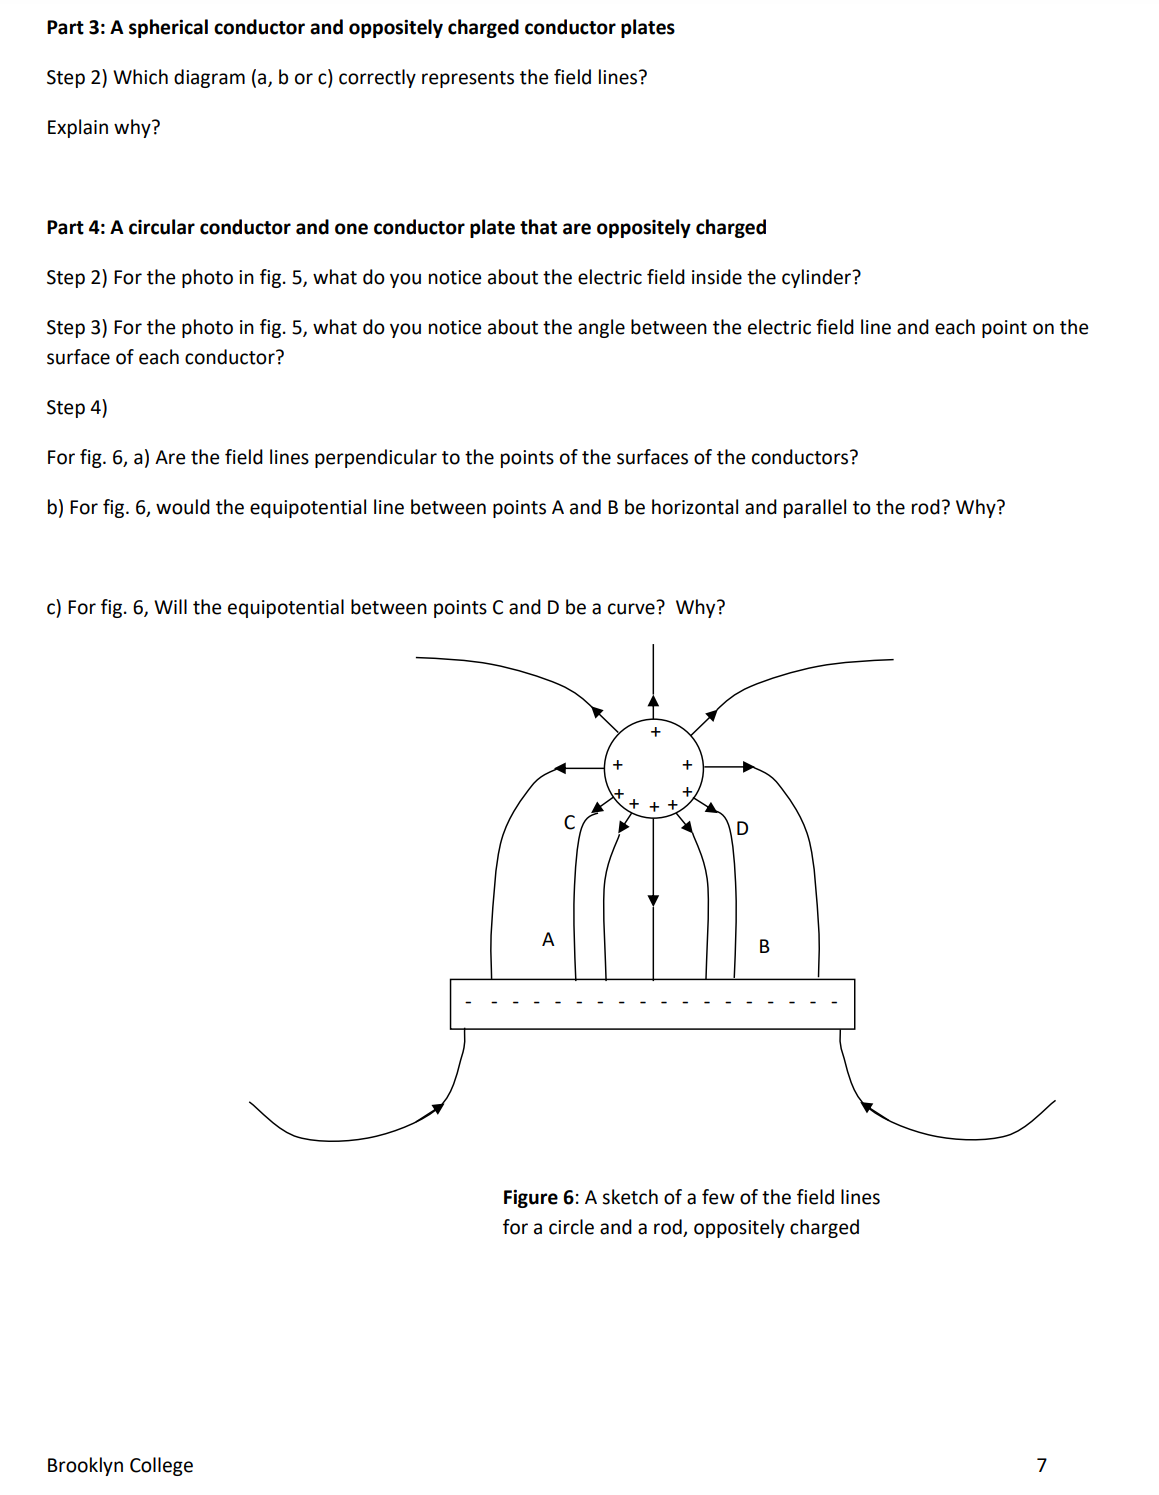


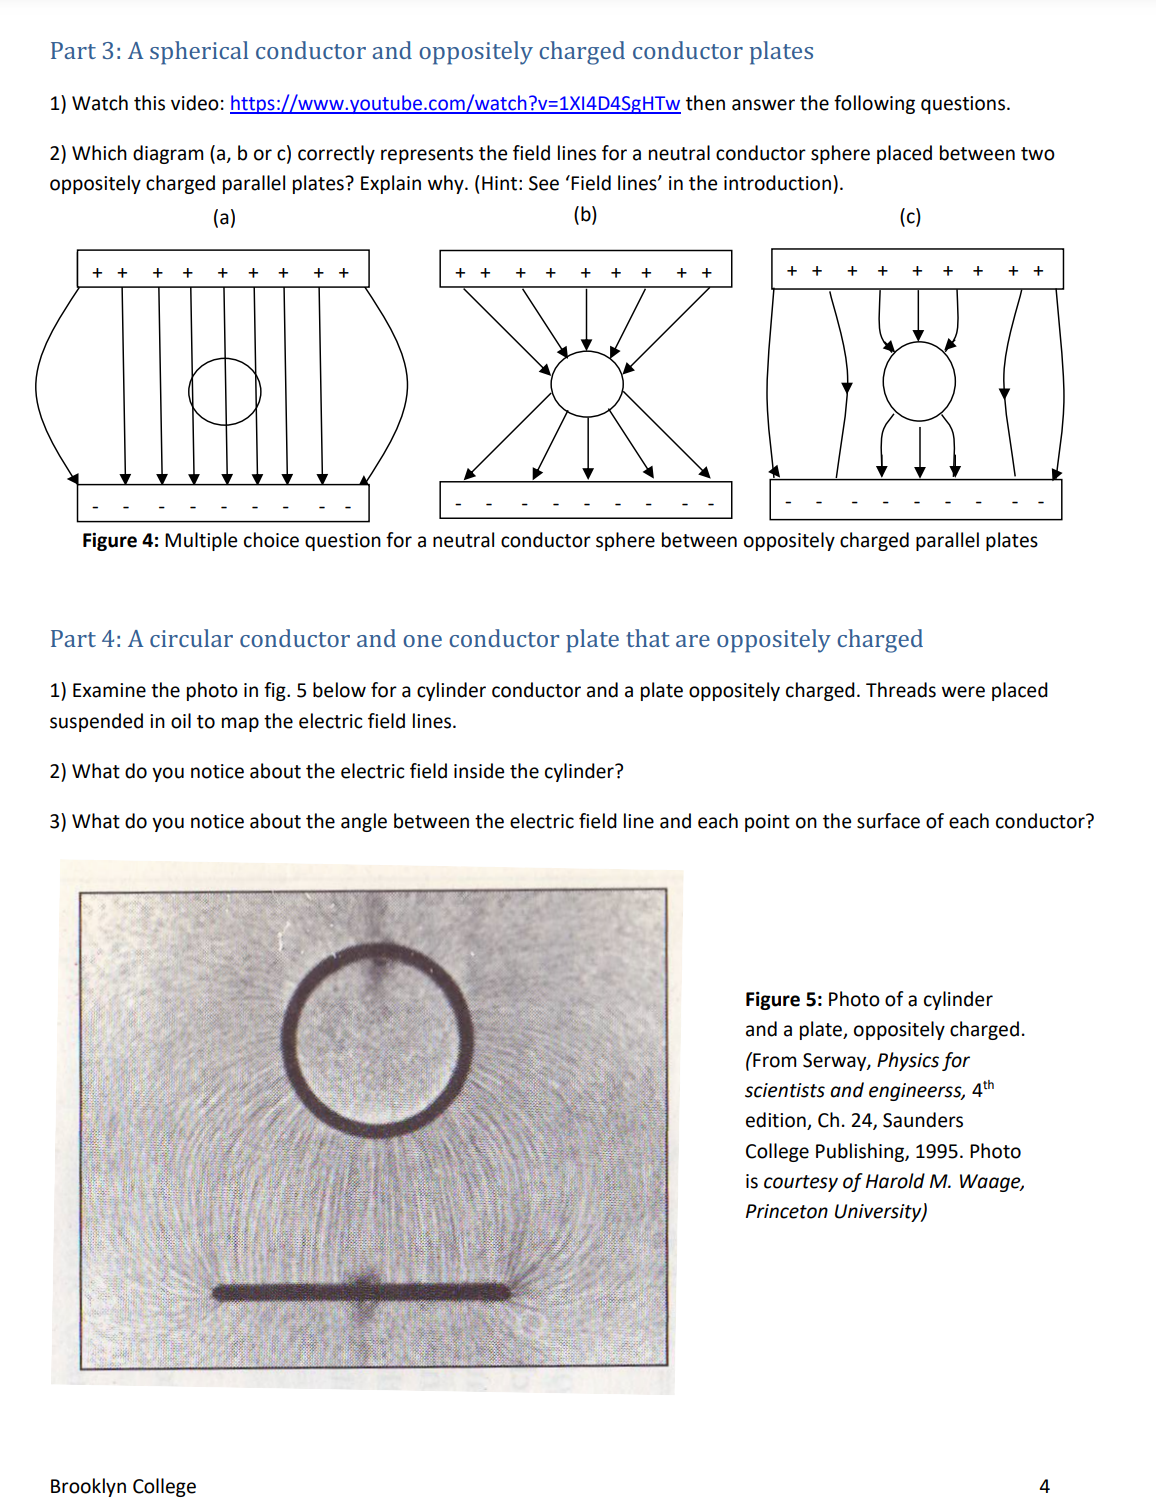
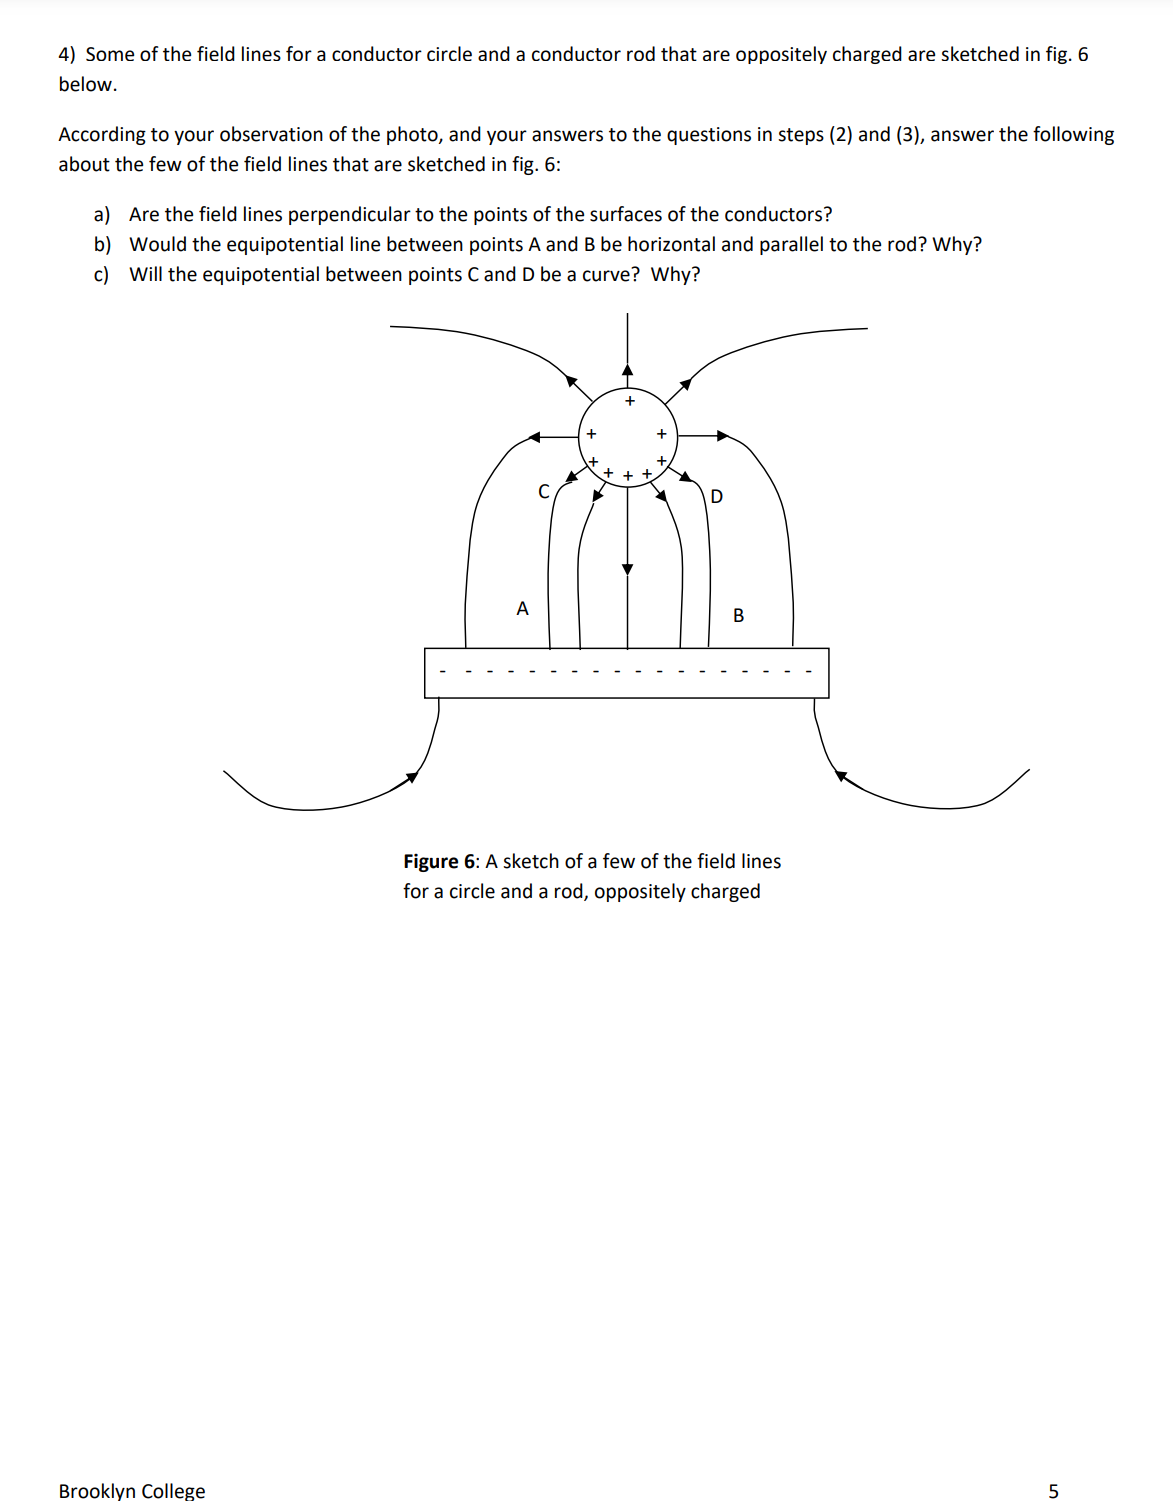


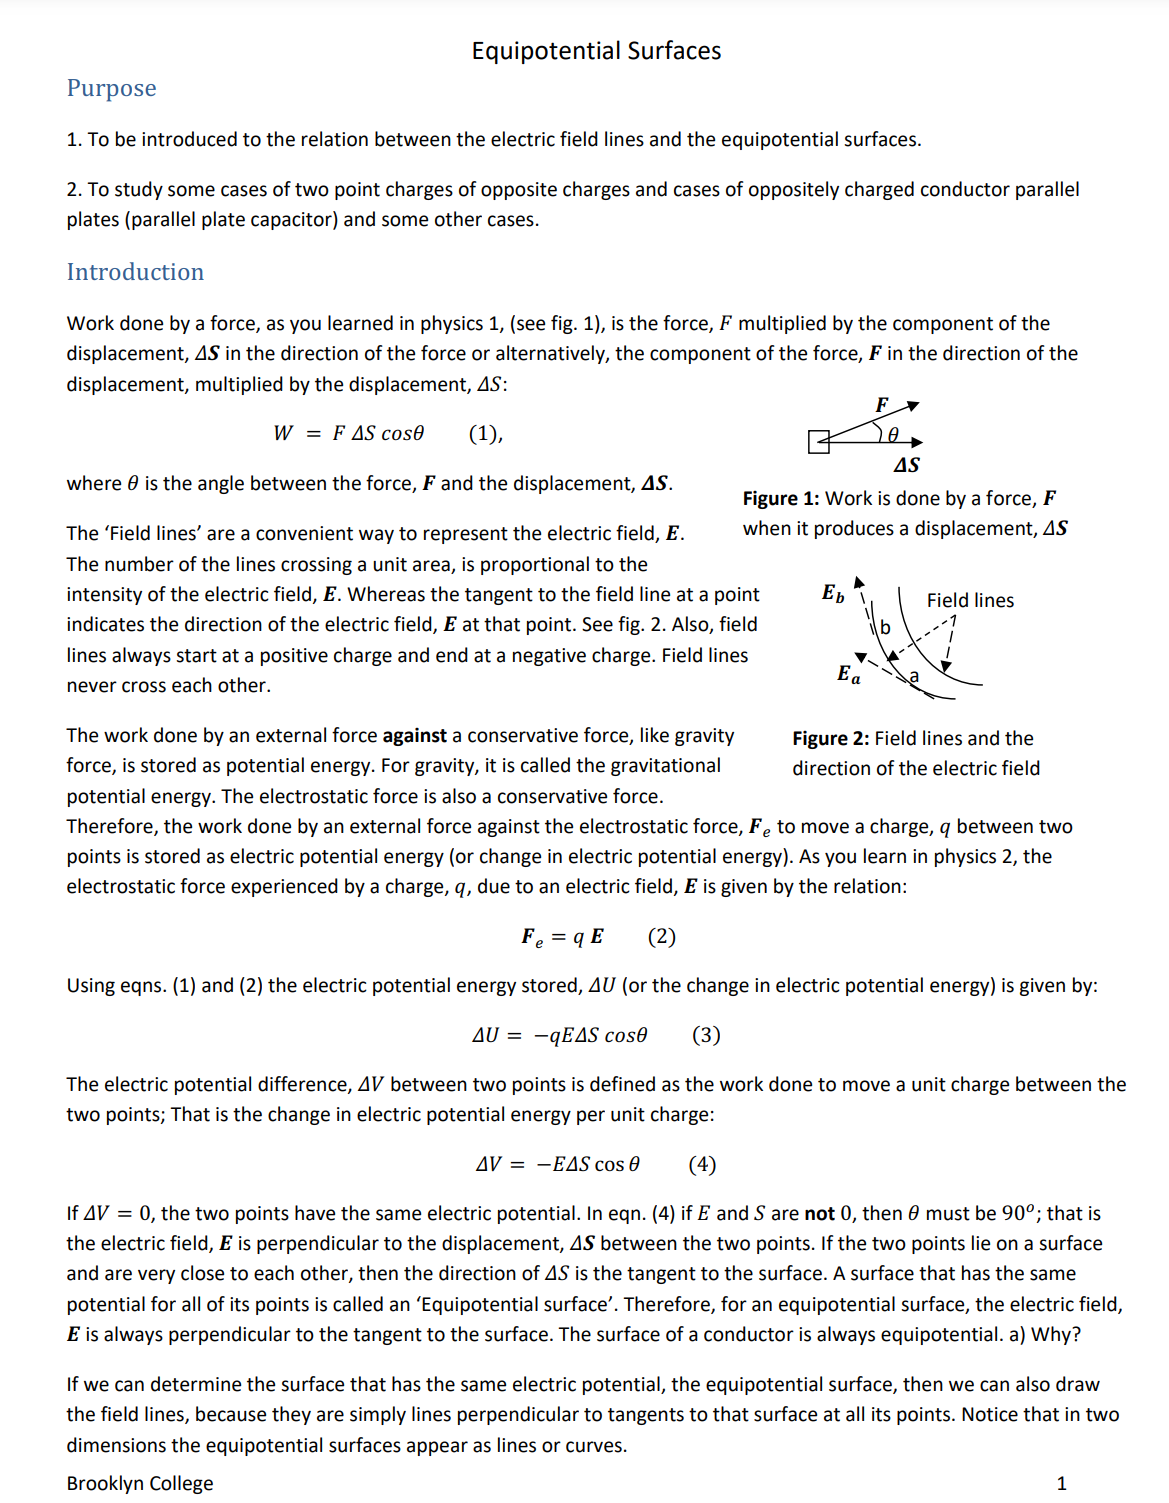
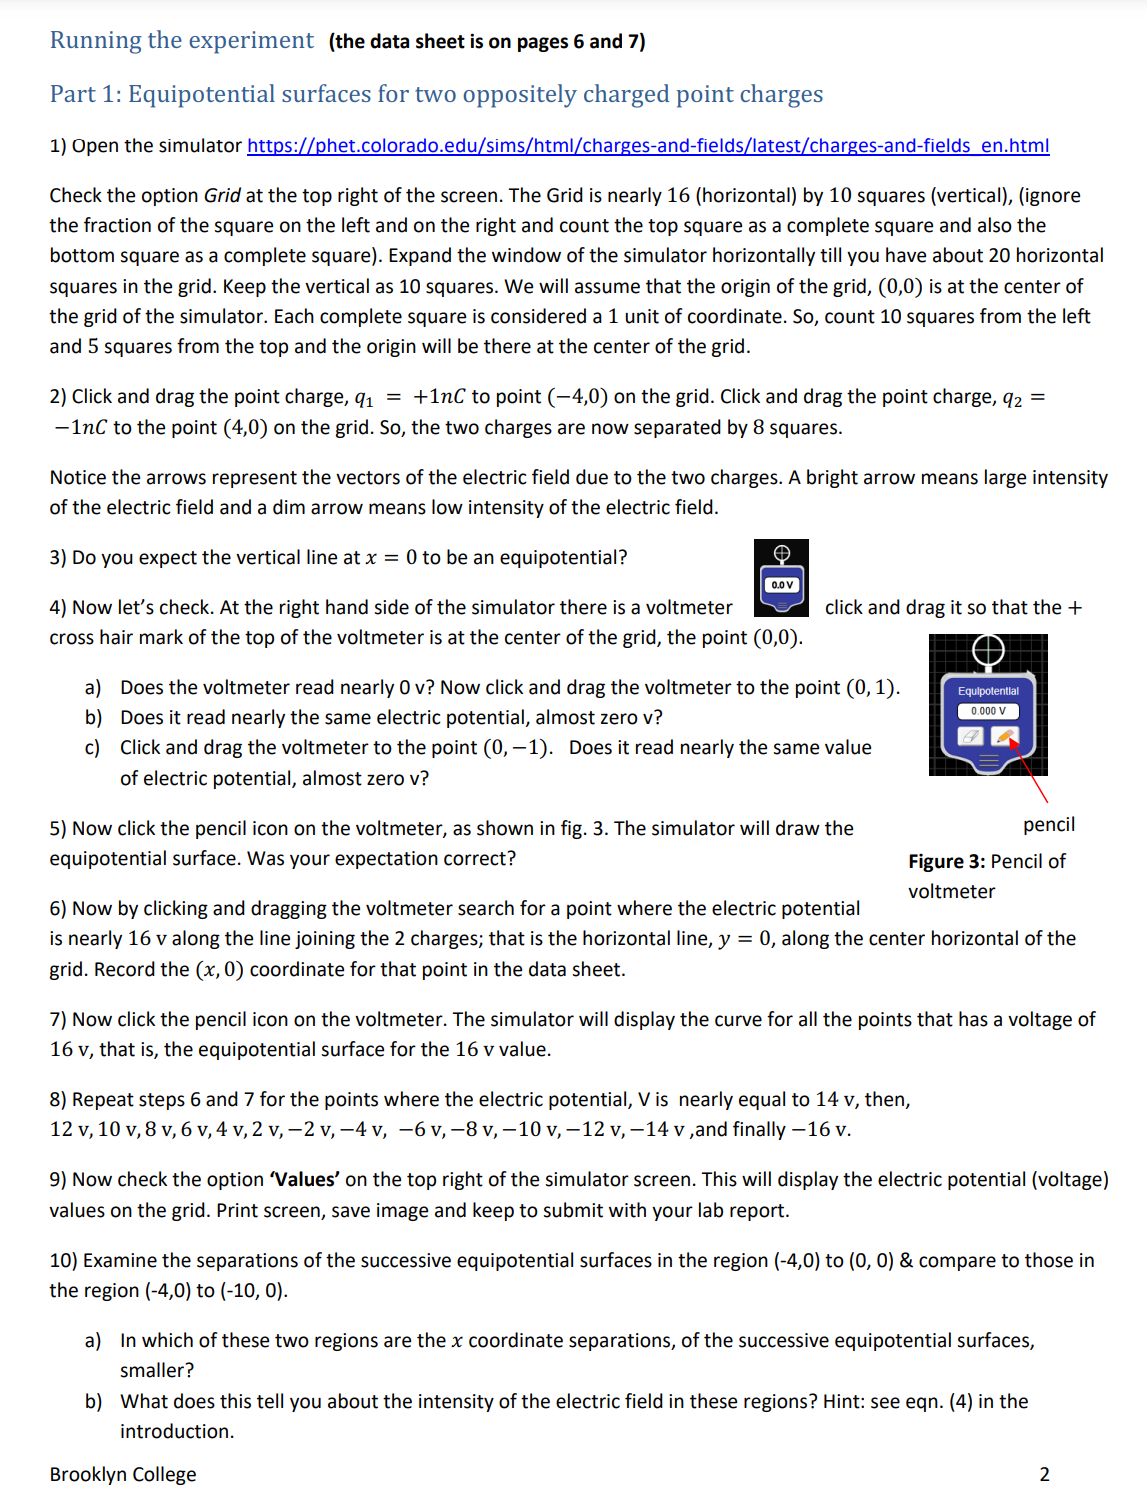


D ata s heet Name: Group: Date experiment performed: Introduction Question: Answer to question a) Why is the surface of a conductor always an equiporential surface? Part 1: Equipotential surfaces for two oppositely charged point charges Step 3) Do you expect the vertical line at x : 0 to be an equipotential? Step 4, a) Step 4, b) Step 5) Step 6) (x, 0) 2 Step 9) Submit your screen shot of the complete equipotential plot forthe electric potential values above. Step 10, a) Step 10, b) Step 11) The angle between the electric field at a point and the equipotential surface atthat point is always equal to Part 2: Field lines fora parallel conductor plates (parallel plate capacitor) Step 2) a) How manyfield lines are there? b) Is the density ofthe field lines constant? c) What does this tell you about the intensity of the electric field for all points between the parallel plates? d) Expectation of how the equipotential surfaces would look like: e) Which equipotential surface will have the highest electric potential? f) which equipotential surface will have the lowest electric potential? Step 3) a) Does the density ofthe field lines increase? b) What does this tell you about the intensity ofthe electric field between the plates now? Step 4) a) What happened to the direction ofthe electric field now? b) Which surface at or between the plates will have the largest electric potential and c) which will have the lowest electric potential? Step5) After you watched the video, were your answers correct for step (2): b) and c) and for step (3): a) and b)? Explain. (continue for parts 3 and 4 on the next page) Brooklyn College 6 Part 3: A spherical conductor and oppositely charged conductor plates Step 2) Which diagram (a, b or c) correctly represents the field lines? Explain why? Part 4: A circular conductor and one conductor plate that are oppositely charged Step 2) Forthe photo in fig. 5, what do you notice about the electricfield inside the cylinder? Step 3) Forthe photo in fig. 5, what do you notice about the angle between the electric field line and each point on the surface of each conductor? Step 4) For fig. 6, a) Are the field lines perpendicular to the points ofthe surfaces ofthe conductors? b) For fig. 6, would the equipotential line between points A and B be horizontal and parallel to the rod? Why? c) For fig. 6, Will the equipotential between points C and D be a curve? Why? Figure 6: A sketch of a few of the field lines for a circle and a rod, oppositely charged Brooklyn College 7 Equipotential Surfaces Purpose 1. To be introduced to the relation between the electric field lines and the equipotential surfaces. 2. To study some cases of two point charges of opposite charges and cases of oppositely charged conductor parallel plates (parallel plate capacitor) and some other cases. Introduction Work done by a force, as you learned in physics 1, (see fig. 1), is the force, F multiplied by the component of the displacement, AS in the direction of the force or alternatively, the component of the force, F in the direction of the displacement, multiplied by the displacement, AS: F W : FASCOSH (1), '1 g : 45 where 0 is the angle between the force, F and the displacement, AS. . . Figure 1: Work IS done by a force, F The 'Field lines' are a convenient way to represent the electric field, E. when it PI'OdUCES a displacement, 45 The number of the lines crossing a unit area, is proportional to the intensity of the electric field, E. Whereas the tangent to the field line at a point Eb >l Field nes indicates the direction of the electric field, E at that point. See fig. 2. Also, field \\ r'; lines always start at a positive charge and end at a negative charge. Field lines K 1 E never cross each other. " The work done by an external force against a conservative force, like gravity Figure 2; Field lines and the force, is stored as potential energy. For gravity, it is called the gravitational direction of the electric field potential energy. The electrostatic force is also a conservative force. Therefore, the work done by an external force against the electrostatic force, I", to move a charge, q between two points is stored as electric potential energy (or change in electric potential energy). As you learn in physics 2, the electrostatic force experienced by a charge, q, due to an electric field, E is given bythe relation: Fe = q E (2) Using eqns. (1) and (2) the electric potential energy stored, AU (or the change in electric potential energy) is given by: AU : qEAS 6050 (3) The electric potential difference, AV between two points is defined as the work done to move a unit charge between the two points; That is the change in electric potential energy per unit charge: AV: EA5c056 (4) IfAl/ : 0, the two points have the same electric potential. In eqn. (4) ifE and 5 are not 0, then 9 must be 90"; that is the electric field, E is perpendicularto the displacement, AS between the two points. lfthe two points lie on a surface and are very close to each other, then the direction of A5 is the tangent to the surface. A surface that has the same potential for all of its points is called an 'Equipotential surface'. Therefore, for an equipotential surface, the electric field, E is always perpendicular to the tangent to the surface. The surface of a conductor is always equipotential. a) Why? If we can determine the surface that has the same electric potential, the equipotential surface, then we can also draw the eld lines, because they are simply lines perpendicularto tangents to that surface at all its points. Notice that in two dimensions the equipotential surfaces appear as lines or curves. Brooklyn College 1 Running the experiment (the data sheet is on pages 6 and 7) Part 1: Equipotential surfaces for two oppositely charged point charges 1) Open the simulator httns://Dhet.colorado.edu/sims/html/chanzesVandeflelds/latest/chanzesrandeflelds en.html Check the option Grid at the top right of the screen. The Grid is nearly 16 (horizontal) by 10 squares (vertical), (ignore the fraction of the square on the left and on the right and count the top square as a complete square and also the bottom square as a complete square). Expand the window of the simulator horizontally till you have about 20 horizontal squares in the grid. Keep the vertical as 10 squares. We will assume that the origin of the grid, (0,0) is at the center of the grid of the simulator. Each complete square is considered a 1 unit of coordinate. So, count 10 squares from the left and 5 squares from the top and the origin will be there at the center of the grid. 2) Click and drag the point charge, 111 : +1nC to point (4-,0) on the grid. Click and drag the point charge, in : 1nC to the point (4,0) on the grid. So, the two charges are now separated by 8 squares. Notice the arrows represent the vectors of the electric field due to the two charges. A bright arrow means large intensity of the electric field and a dim arrow means low intensity ofthe electric field. 3) Do you expect the vertical line at x : 0 to be an equipotential? 4) Now let's check. At the right hand side of the simulatorthere is a voltmeter cross hair mark of the top of the voltmeter is at the center of the grid, the point (0,0). a) Does the voltmeter read nearly 0 v? Now click and drag the voltmeter to the point (0, 1). Equlw'mu.' b) Does it read nearly the same electric potential, almost zero v? c) Click and drag the voltmeter to the point (0, 1). Does it read nearlythe same value of electric potential, almost zero v? 5) Now click the pencil icon on the voltmeter, as shown in g. 3. The simulator will draw the pencil equipotential surface. Was your expectation correct? Figure 3: Pencil of voltmeter 6) Now by clicking and dragging the voltmetersearch for a point where the electric potential is nearly 16 v along the line joining the 2 charges; that is the horizontal line, )1 : 0, along the center horizontal ofthe grid. Record the (x, 0) coordinate for that point in the data sheet. 7) Now click the pencil icon on the voltmeter. The simulator will display the curve for all the points that has a voltage of 16 v, that is, the equipotential surface for the 16 vvalue. 8) Repeat steps 6 and 7 for the points where the electric potential, V is nearly equal to 14 v, then, 12 v, 10 v, 8 v, 6 v, 4- v, 2 v, Z v, 4 v, 6 v, 8 v, 10 v, 12 v, 14 v ,and finally 16 v. 9) Now check the option Values' on the top right of the simulator screen. This will display the electric potential (voltage) values on the grid. Print screen, save image and keep to submit with your lab report. 10) Examinethe separations of the successive equipotential surfaces in the region (4,0) to (0, O) & compare to those in the region (4,0) to (710, 0). a) In which of these two regions are the x coordinate separations, of the successive equipotential surfaces, smaller? b) What does this tell you about the intensity of the electric field in these regions? Hint: see eqn. (4) in the introduction. Brooklyn College 2 11) What is the angle between the electric field at any point and the equipotential surface passing through that point? Part 2: Field lines for a parallel conductor plates [parallel plate capacitor] 1) Open the simulator https://ohet.colorado.edu/sims/html/caoacitorrlabrbasics/Iatest/capacitorelabrbasics en.html Click 'Capacitance'. Keep all default settings. In the top left ofthe screen check the option 'Top Plate charge'. This will display the charge on the top plate. Notice the default is zero since the battery is set to zero volts. 2) Click and drag to move the slider on the battery up till the charge on the top plate becomes 0.10 pC. On the top right of the screen, check the option 'Electric Field'. This displays the field lines of the electric field between the plates. a) Count how many field lines are there. b) Is the density of the field lines constant between the plates or are they more crowded at certain points? c) What does this tell you about the intensity of the electric field for all points between the parallel plates? Notice that the field lines are perpendicular to the parallel plates of the capacitor. d) Can you predict how the equipotential surfaces would look like between the two plates? e) Which equipotential surface, between or at the two plates, will have the highest electric potential? And f) Which equipotential surface will have the lowest electric potential? 3) Now move the slider on the battery upwards so that the charge of the top plate is 0.30 mi. Notice the field lines now. a) Does the density of the field lines increase? b) What does this tell you about the intensity of the electric field between the plates now? 4) Now move the slider on the battery to the lower part of the battery so that the charge on the top plate becomes 030 pL' (this time notice that this charge on the top plate is a negative charge, although the box at the top of the simulator does not write the negative, but it shows the negative charge correctly on the top plate of the capacitor itself). a) What happened to the direction ofthe electric field now? b) Which surface at or between the plates will have the largest electric potential and c) Which will have the lowest electric potential? 5) Watch this video htt 5: www. outube.com watch?v=XSXKk A3xUM After you watch the video review your answer to step (2): b) and c) and to step (3): a) and b) above. Explain. Brooklyn College 3 Part 3: A spherical conductor and oppositely charged conductor plates 1) Watch this video: httpszz(www.youtubeecomlwatch?v=1)(I4D4$gHTw then answer the following questions 2) Which diagram (3, b or c) correctly represents the eld lines for a neutral conductor sphere placed between two oppositely charged parallel plates? Explain why (Hint: See 'Field lines' in the introduction} (a) (b) (c) ++ +++++++++ +++++++++ + +++ ill Figure 4: Multiple choice question for a neutral conductor sphere between oppositely charged parallel plates Part 4: A circular conductor and one conductor plate that are oppositely charged 1) Examine the photo in g. 5 below for a cylinder conductor and a plate oppositely charged Threads were placed suspended in oil to map the electric field lines 2) What do you notice about the electric field inside the cylinder? 3] What do you notice about the angle between the electric field line and each point on the surface of each conductor? Figure 5: Photo of a cylinder and a plate, oppositely charged. (From Serway, Physics for scientists and engineEfSS, 4'" edition, Ch, 24, Saunders College Publishing, 1995' Photo is courtesy afHarold M. Waage, Princeton University} Brooklyn College 4 4) Some ofthe field lines for a conductor circle and a conductor rod that are oppositely charged are sketched in fig. 6 below. According to your observation of the photo, and your answers to the questions in steps (2) and (3), answer the following about the few of the field lines that are sketched in fig. 6: a) Are the field lines perpendicular to the points ofthe surfaces of the conductors? b) Would the equipotential line between points A and B be horizontal and parallel to the rod? Why? c) Will the equipotential between points C and D be a curve? Why? Figure 6: A sketch of a few of the field lines for a circle and a rod, oppositely charged Brooklyn College 5
Step by Step Solution
There are 3 Steps involved in it

Get step-by-step solutions from verified subject matter experts