

Question: (d) Based on your simulation results obtained in Problem 1(b), plot the number of customers in the queue (Q(t)) and the machine status (B(t)) over
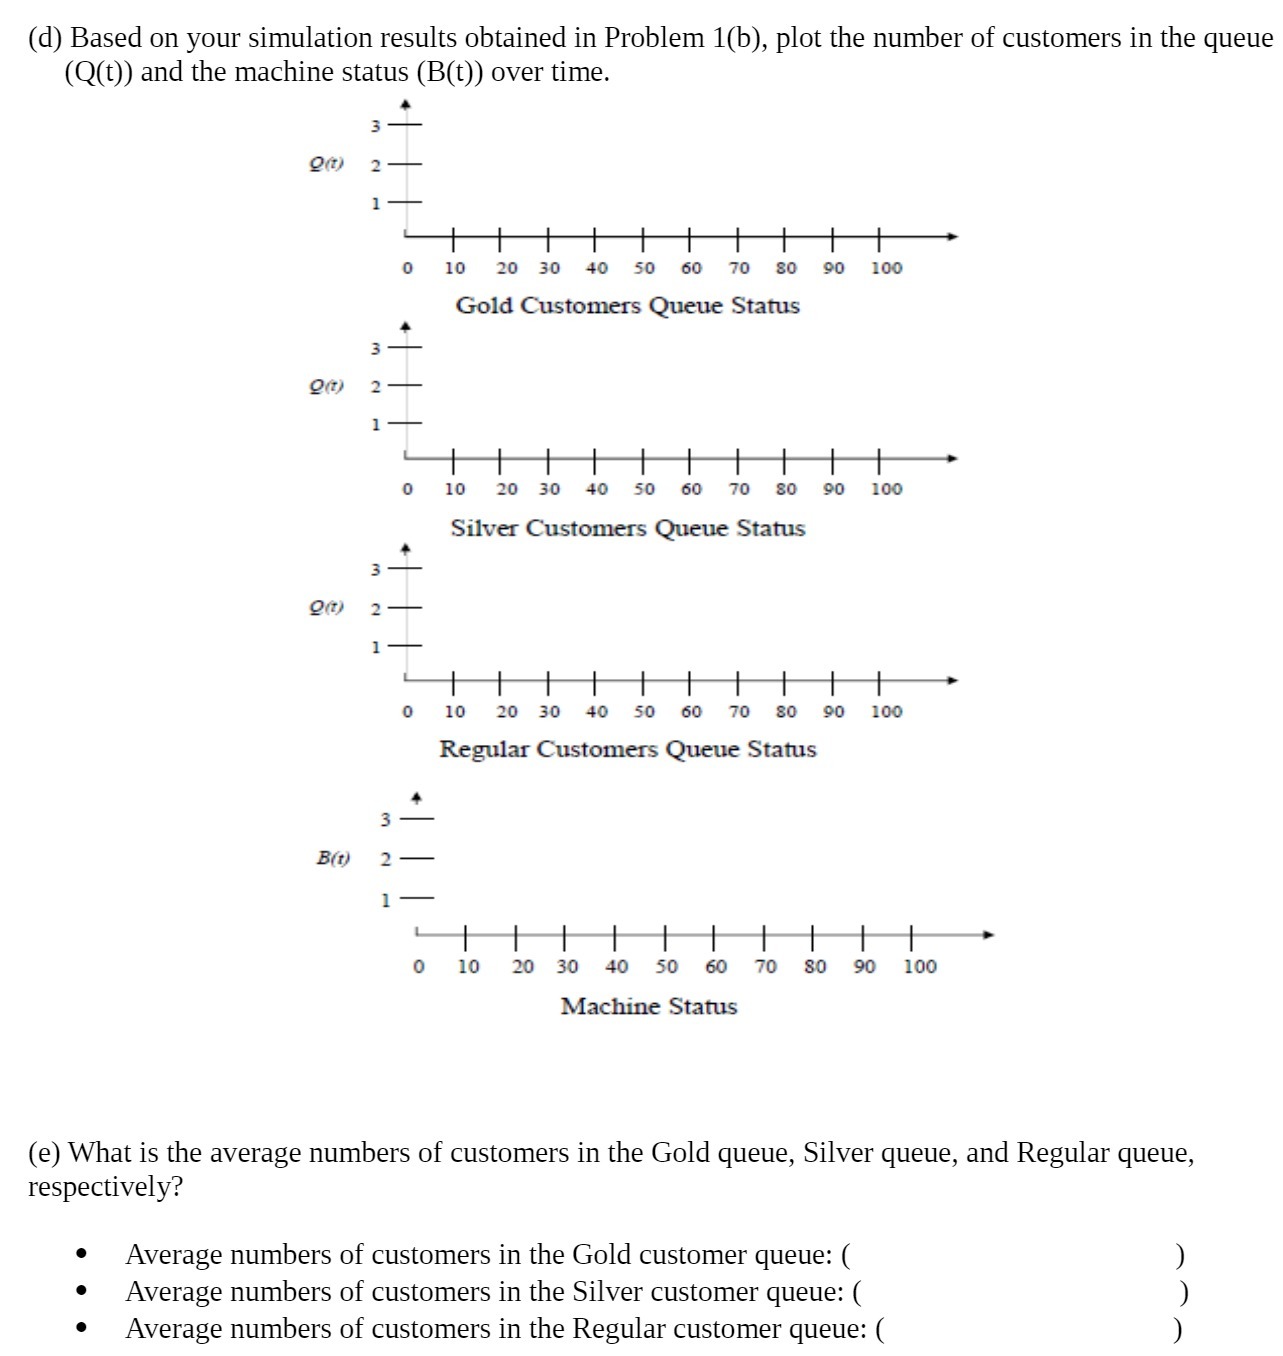
(d) Based on your simulation results obtained in Problem 1(b), plot the number of customers in the queue (Q(t)) and the machine status (B(t)) over time. 2(t) o 10 20 30 40 50 60 70 80 90 100 Gold Customers Queue Status O(t) 2 10 20 50 80 90 100 Silver Customers Queue Status 3 - P(t) 2 - 0 10 40 50 60 70 80 90 100 Regular Customers Queue Status B(t) 1 10 20 30 50 60 70 80 90 100 Machine Status (e) What is the average numbers of customers in the Gold queue, Silver queue, and Regular queue, respectively? . Average numbers of customers in the Gold customer queue: ( Average numbers of customers in the Silver customer queue: ( Average numbers of customers in the Regular customer queue: (
Step by Step Solution
There are 3 Steps involved in it

Get step-by-step solutions from verified subject matter experts